Trading Levels and Reports for November 2, 2012

Jump to a section in this post:

1. Market Commentary
2. Support and Resistance Levels – S&P, Nasdaq, Dow Jones, Russell 2000, Dollar Index
3. Support and Resistance Levels – Gold, Euro, Crude Oil, T-Bonds
4. Support and Resistance Levels – Corn, Wheat, Beans, Silver
5. Economic Reports for Thursday November 1, 2012


Hello Traders,

 Monthly Unemployment numbers tomorrow at 7:30 AM central time, an hour before cash open.

This is a market moving report so be aware!

DESCRIPTION
Monthly change in employment excluding the farming sector. Nonfarm payrolls is an influential statistic and economic indicator released monthly by the US Bureau of Labor Statistics as part of a comprehensive report on the state of the labor market. Payroll jobs move with the economy and help define business cycles; the figure is therefore analysed to determine whether the economy is expanding or contracting.As the Federal Reserve is mandated to establish a monetary policy that ensures maximum employment, the Fed pays particular attention to this employment statistic. A surge in new nonfarm payrolls suggests rising employment and thus potential inflationary pressures, which the Fed often counters with rate increases. On the other hand, a consistent decline in nonfarm employment suggests a slowing economy, which makes a decrease in rates more likely.
WEB ADDRESS
http://www.bls.gov/

Also please like us on Facebook!!

Trading Levels and Reports for October 31, 2012

Jump to a section in this post:

1. Market Commentary
2. Support and Resistance Levels – S&P, Nasdaq, Dow Jones, Russell 2000, Dollar Index
3. Support and Resistance Levels – Gold, Euro, Crude Oil, T-Bonds
4. Support and Resistance Levels – Corn, Wheat, Beans, Silver
5. Economic Reports for Wednesday October 30, 2012


Hello Traders,

Looks like we should finally resume normal trading starting this evening and into tomorrow’s trading session:

CME Group will reopen its U.S. equity index futures and options on futures markets today at 5:00 p.m. CT and resume normal trading hours on the trading floor and CME Globex venues tomorrow. CME Group’s interest rate complex reopened for electronic trading on Monday evening, October 29, and has since resumed trading on the floor and electronically, observing regular trading hours. With the reopen of our equity complex, all CME Group electronic markets will be open during normal trading hours this evening and tomorrow, Wednesday, October 31, 2012.

In addition, we will open the New York trading floor contingent upon New York City lifting the evacuation order for Zone A, which includes CME Group’s NYMEX World Headquarters and the New York trading floor. All New York floor-traded products remain available on CME ClearPort as well as CME Globex during their regular market hours.

Trading Levels and Reports for 10-30-2012

Jump to a section in this post:

1. Market Commentary
2. Support and Resistance Levels – S&P, Nasdaq, Dow Jones, Russell 2000, Dollar Index
3. Support and Resistance Levels – Gold, Euro, Crude Oil, T-Bonds
4. Support and Resistance Levels – Corn, Wheat, Beans, Silver
5. Economic Reports for Tuesday October 30, 2012


Hello Traders,

Hurricane Sandy shut down the NYSE and in return CME and ICE shut down trading on stock index futures earlier this morning and then shut down interest rates earlier than normal.


As of this moment, CME plans on having NORMAL trading for tonight and tomorrow’s session.


If we hear anything different we will update you and feel free to check the CME website for any updates:


http://www.cmegroup.com/


Trading Levels and Reports for October 26, 2012

Jump to a section in this post:

1. Market Commentary
2. Support and Resistance Levels – S&P, Nasdaq, Dow Jones, Russell 2000, Dollar Index
3. Support and Resistance Levels – Gold, Euro, Crude Oil, T-Bonds
4. Support and Resistance Levels – Corn, Wheat, Beans, Silver
5. Economic Reports for Thursday October 25, 2012


Hello Traders,

By my colleague from www.TradingeMini.com


Mental Risk Management


“When you learn what not to do in order not to loose, only then can you begin to learn what to do in order to win” Edwin Lefevre, Reminiscences of a Stock Operator


1. Managing Position Size

Size envy can make traders take larger positions than they should. Most people can’t walk straight into a gym and bench press 300lbs. Traders must build up financial capacity, technical skills and emotional development, judging progress against their own levels not others.


2. Dreaming of a Big Win

This is the earmark of a beginner. The key to success is consistency, steadily achieving profits with a simple sound process and using runners catch the larger moves or position trade with a separate broker account. A successful athlete focuses on the steps to achieve results not the results.


3. Vengeance Trading

Vengeance trading is when a trader takes a hit and wants to get even with the market risking financial, emotional capital. The angry trader wants revenge, to prove they were right, so they stubbornly enter in the same direction as the loosing trade, focusing on where the trade did not go, rather than where another trade could go in a market which is always impersonal and never wrong.


4. Boredom

The mind will go to great lengths to avoid boredom. A Gamblers Anonymous maxim holds that gambling, or overtrading, is a sign of boredom, so recognize when you are becoming bored and dismiss it as a false emotional trigger.


5. The Averaging Down Sin

Averaging down is adding to a looser, with the hope that it will turn around, without regard for the reality of what your charts are telling you. Never average down, you are stubbornly refusing to admit you are wrong.


6. Are you Trading Intelligently or Gambling

Successful traders trigger when the odds are favourable. Gamblers trigger on hope. A gambler can’t explain why they won other than they had a “gut feeling”. They trade for excitement, with no plan or discipline, unwilling to accept reality, believing they can have good things without effort.

The Gamblers Anonymous 12-steps can help control loses. For example,

“Make a searching and fearless moral and financial inventory of ourselves” Know why you want to be a trader, what you expect to get out of it and whether you really have the right support and financial basis to trade.

“Admit to ourselves and to another human being the exact nature of our wrongs” Keep an honest trading journal and have an accountability group, be it other traders, friends or family.

“Continue to take a personal inventory, and when we are wrong, promptly admit it” When in a bad trade admit it and get out. You must take personal responsibility for your actions and not blame others or “The market”.


Trading can be enjoyable and social, gambling is lonely and heartbreaking, The Recovery Book sums it up in one sentence “To gamble risking progressive deterioration OR Not to gamble and develop a better way of life”.
 

Trading Levels and Reports for October 25, 2012

Jump to a section in this post:

1. Market Commentary
2. Support and Resistance Levels – S&P, Nasdaq, Dow Jones, Russell 2000, Dollar Index
3. Support and Resistance Levels – Gold, Euro, Crude Oil, T-Bonds
4. Support and Resistance Levels – Corn, Wheat, Beans, Silver
5. Economic Reports for Thursday October 25, 2012


Hello Traders,

 FOMC is behind us until Dec. 11-12 which is the next meeting. News summary below:


WASHINGTON (MarketWatch)  The Federal Reserve on Wednesday continued to express concern about the economy as it made no changes to its ultra-easy policy stance. In its statement, the Fed said that growth had been moderate. While consumer spending had picked up, business spending had slowed. The Fed also said that inflation had picked up somewhat, due to higher energy prices.Read full FOMC statement. The Fed decision maintains its third-round of asset purchases, known as quantitative easing or QE3, unveiled in September, that consists of $40 billion of mortgage-backed securities. The Fed is also buying $45 billion of Treasurys offset by sales of shorter-term securities under its Operation Twist program launched in September 2011. The Fed believes these purchases put downward pressure on longer-term interest rates and ease financial conditions to support growth. Stocks rallied in the wake of the Sept. 13 Fed move, with the Dow industrials surging 206 points, or 1.6% that day. But from the Sept. 12 close through Tuesdays finish, the Dow had retreated 230.83 points, or 1.7%. In its statement, the Fed did not change the open-ended nature of the MBS purchases, repeating that they would continue until the labor market outlook improved substantially.  The Labor Department reported earlier this month that the unemployment rate dropped to 7.8% in October, the lowest rate since 2009. But the Fed indicated that is not enough. In its statement, the Fed said that growth in employment has been slow and the unemployment rate remains elevated. The Fed also repeated that it expects to keep short-term interest rates unchanged until mid-2015. The Fed kept its key new language, adopted in September, to hold rates near zero even after the recovery strengthens.  On balance, the economy appears to be stuck in a slow gear. Economists surveyed by MarketWatch estimate the U.S. expanded at a 1.6% clip in the third quarter, somewhat faster than the 1.3% pace in the prior three-month period, but still not strong enough to generate a large amount of new jobs.  The initial estimate of growth in the July-September quarter will be released Friday.  The vote of the Feds interest-rate setting committee on Wednesday was 11 to 1. A rotating set of 12 of the 19 Fed officials vote on rate policy. The dissenter was Richmond Fed President Jeffrey Lacker, who has dissented at every meeting this year. Lacker said he disagreed with the asset purchases and the mid-2015 calendar date for the first rate hike. Economists had expected a vanilla statement after the big changes in September and with the presidential elections less than two weeks away. Behind closed doors Behind closed doors, two issues likely dominated the discussion, economists said. The first is what the Fed will do when it Twist program expires at the end of the year.  Several Fed officials have spoken in favor of the new bond-buying to hold purchases at the $85 billion monthly rate when Operation Twist ends. Many economists think the Fed will announce such a program on December 12 after its next two-day meeting. But others said the Fed will take its cues from whether, or how, Congress and the White House address the fiscal cliff, the combination of tax hikes and spending cuts now scheduled to hit the economy at the start of the year. The second question is whether the Fed will rework its forward guidance to adopt numerical targets for inflation and unemployment and abandon its calendar date. This would work something along the lines of a plan advocated by Charles Evans, the president of the Chicago Fed, who wants the Fed to tell the market that it would keep interest rates near zero, as long as unemployment remains above 7%, and as long as inflation does not threaten to rise above 3%. The first step towards numerical targets will be a consensus forecast of the 12 voters on the Feds interest-rate setting panel. At the moment, the Fed provides a summary of individual policymakers forecasts. The Feds policy statement did not discuss refining the guidance. Fed watchers will be watching speeches by the top Fed officials and waiting to the minutes of the meeting to get a sense on how close the Fed is to changing the language and adopting a consensus forecast. The minutes will be released on November 15. This is one of those meetings where the minutes will be more interesting than the policy statement, said Lou Crandall, chief economist at Wrightson ICAP.  After the December meeting, the Fed will also release updated forecasts and Federal Reserve Chairman Ben Bernanke will hold a press conference. Analysts view the meeting with press conferences to be more likely to contain policyshifts, so that the chairman can elaborate on the reasons behind the moves. (TS:DJIA;)

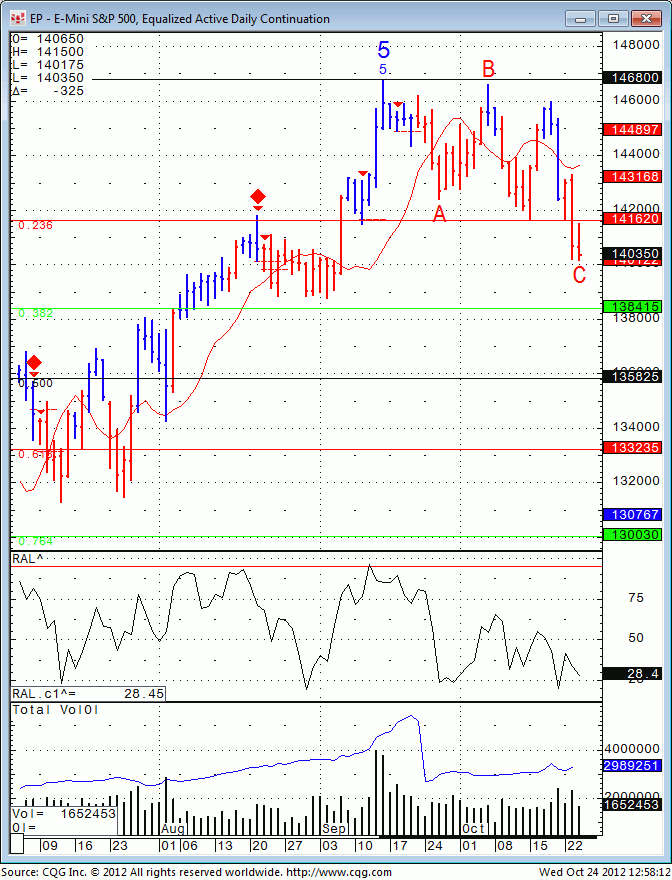
As far as trading, what I wrote yesterday, still holds true today: 1391 is a major support level and how the market will react if we visit this level soon, will provide futures clues. This time I am sharing the daily chart for your review below:
 mini sp daily


Trading Levels and Reports for October 24, 2012

Jump to a section in this post:

1. Market Commentary
2. Support and Resistance Levels – S&P, Nasdaq, Dow Jones, Russell 2000, Dollar Index
3. Support and Resistance Levels – Gold, Euro, Crude Oil, T-Bonds
4. Support and Resistance Levels – Corn, Wheat, Beans, Silver
5. Economic Reports for Wednesday October 24, 2012


Hello Traders,

Stock Index futures living up for their “October reputation” with a small sell off over the last few days. While the overall up trend is still in tact, I think we may see an additional pullback first.

1391 is a major support level and how the market will react if we visit this level soon, will provide futures clues.
DON’T FORGET FOMC is tomorrow as well…..

Regardless of the longer term picture ( weekly mini SP chart for your review below), as volatility increases, I recommend day-traders to DECREASE trading size in order to allow oneself a chance to stay in trades while volatility is higher.

weekly mini s&p chart


Trading Levels and Reports for October 23, 2012

Jump to a section in this post:

1. Market Commentary
2. Support and Resistance Levels – S&P, Nasdaq, Dow Jones, Russell 2000, Dollar Index
3. Support and Resistance Levels – Gold, Euro, Crude Oil, T-Bonds
4. Support and Resistance Levels – Corn, Wheat, Beans, Silver
5. Economic Reports for Tuesday October 23, 2012


Hello Traders,


Bernanke’s Bigger Bubble: QE-3 and the Coming Economic Crash
Why monetarist theory is flawed
By Elliott Wave International

We’ve all heard the definition of insanity: doing the same thing over and over and expecting a different result. Why should we think QE-3 will work when the previous two failed? (Don’t think they failed? Then ask yourself why we need a third one.) Monetary policy cannot make the global credit bubble simply vanish. Only a deflationary crash can do that. The chart below reveals why…Read More.


Trading Levels and Reports for October 19, 2012

Jump to a section in this post:

1. Market Commentary
2. Support and Resistance Levels – S&P, Nasdaq, Dow Jones, Russell 2000, Dollar Index
3. Support and Resistance Levels – Gold, Euro, Crude Oil, T-Bonds
4. Support and Resistance Levels – Corn, Wheat, Beans, Silver
5. Economic Reports for Friday October 19, 2012


Hello Traders,

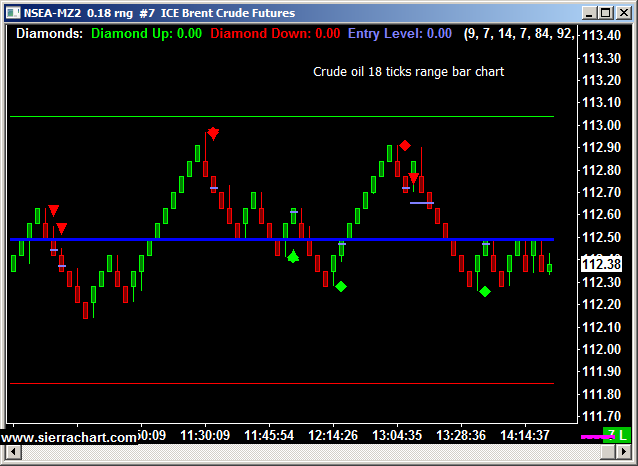
I was talking to a client of mine about “other markets to trade other than the mini SP” and we were chatting on how the mini SP market has many institutions and large size traders which sometimes make it harder to get filled on limit orders. Not just that, the mini SP500 simply has a different “personality” than most other markets…Don’t get me wrong, I like the mini SP a lot because it CAN handle volume. If you are looking at other markets, than the mini Nasdaq 100 might be another stock index to look at.


When it comes to crude oil, I just found out today that BRENT CRUDE which trades on ICE Europe actually has higher volume…..

Just some food for thought and “knowledge sharing”

Chart of BRENT CRUDE OIL ( “north sea crude”  ) below for your review:


Intra day Ice Brent Crude Futures


If you would like to have a trial of the above charting software visit:

https://www.cannontrading.com/software/transact-at


Trading Levels and Reports for October 18, 2012

Jump to a section in this post:

1. Market Commentary
2. Support and Resistance Levels – S&P, Nasdaq, Dow Jones, Russell 2000, Dollar Index
3. Support and Resistance Levels – Gold, Euro, Crude Oil, T-Bonds
4. Support and Resistance Levels – Corn, Wheat, Beans, Silver
5. Economic Reports for Thursday October 18, 2012


Hello Traders,

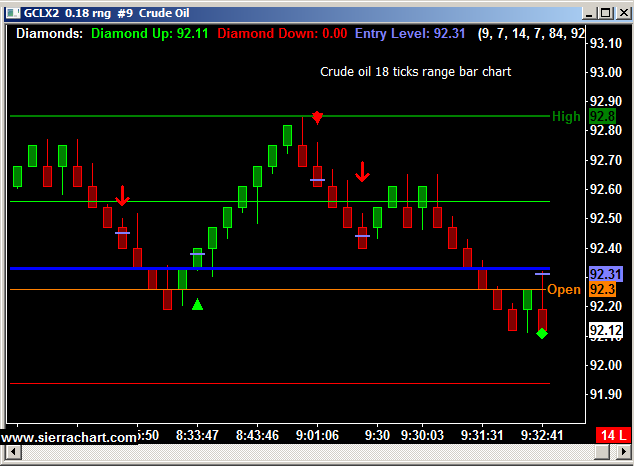
Many clients have asked me over the years: “what other markets do you like for day-trading?” and my answer includes markets like gold, us bonds and crude oil.

Crude Oil is one of these markets that can reward and/or punish day traders very quickly….It is a volatile market and if you are a trader that refuses to use stops….then this is defintely NOT your market for day-trading.

Crude Oil inventories come out weekly on Wednesdays at 9:30 Central time.

This report has a large impact on Crude Oil prices.

Below you will see an intra day chart from todays session reflecting price action during this report.

1350503521763


If you would like to have a trial of the above charting software OR simply get a second opinion on your trading needs and methods, please visit our trader’s profile.

On a different note, we are now in stock earnings season, which will affect stock index futures price action.

A good source to follow earning reports and release times is:

http://earnings.com/highlight.asp?client=cb