Jump to a section in this post:
1. Market Commentary
2. Support and Resistance Levels – S&P, Nasdaq, Dow Jones, Russell 2000, Dollar Index
3. Support and Resistance Levels – Gold, Euro, Crude Oil, T-Bonds
4. Support and Resistance Levels – Corn, Wheat, Beans, Silver
5. Economic Reports for Tuesday September 25, 2012
Hello Traders,
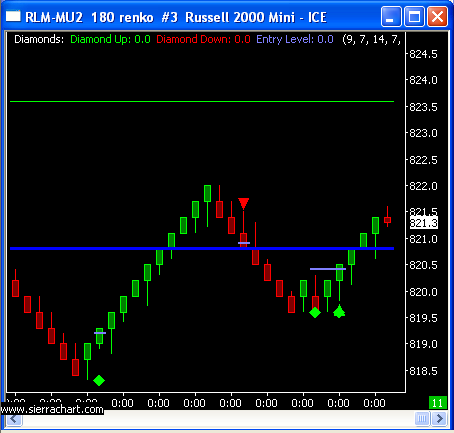
Screen shot from todays “live trading signals” session of the mini Russell 2000 below for your review.
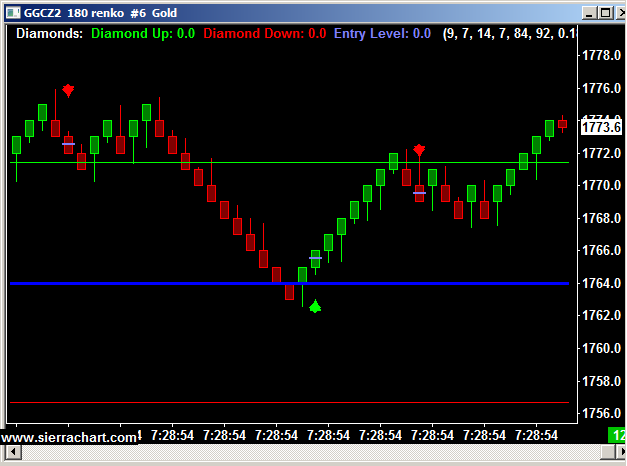
During this daily screen sharing, I have my screen up for live viewing along with several charts of different markets. The charts include potential buy/ sell signals along with possible targets/ stops etc.
While there is rarely any voice commentary, i do answer questions during these sessions
The charts include some of my proprietry studies and ALGO I have developed that look for “turning points” in the markets on a day-trading basis.
I offer a two week trial period where one can get a daily invitation to view my charts running live AND/OR install the custom indicators on their own SIERRA charts so it can be applied to different markets and different time frames.
The trial is free. If one decides to subscribe to the service, the cost is $119 per month if you are a client of Cannon trading and $199 per month if you are not a client.


