Bond Futures Outlook 5.03.2016

Connect with Us! Use Our Futures Trading Levels and Economic Reports RSS Feed.

Like us on FacebookFollow us on TwitterView our profile on LinkedInFind us on Google+Cannon Trading Futures Trading Resistance & Support Levels and Economic ReportsFind us on Yelp

1. Market Commentary
2. Futures Support and Resistance Levels – S&P, Nasdaq, Dow Jones, Russell 2000, Dollar Index
3. Commodities Support and Resistance Levels – Gold, Euro, Crude Oil, T-Bonds
4. Commodities Support and Resistance Levels – Corn, Wheat, Beans, Silver
5. Futures Economic Reports for Tuesday May 3, 2016

Hello Traders,

For 2016 I would like to wish all of you discipline and patience in your trading!

Voted #1 futures trading blog!

Greetings!

May started with some of the European markets closed or abbreviated due to “May Day”. Nice up move on stocks and nice down move on bonds/ 10 years.  I mentioned this before on how I like bonds and 10 years as another market to observe and day trade.  It has a different personality and behaves quite differently than stock index futures ( many times inverse correlation), energy or metal futures.

Interest Rates, 10 year and 30 year.

In most platforms, the symbols are ZB for 30 year bonds and ZN for 10 year notes. The current front month is June which is M. So ZBM6 for example.

Product Symbol ZB
Contract Size The unit of trading shall be U.S. Treasury Bonds having a face value at maturity of one hundred thousand dollars ($100,000) or multiples thereof
Price Quotation
Points ($1,000) and 1/32 of a point. For example, 134-16 represents 134 16/32. Par is on the basis of 100 points.
 
Product Symbol ZN

Gold Futures Could Break Out — Here’s the Trading Strategy You Could Use 4.29.2016

Connect with Us! Use Our Futures Trading Levels and Economic Reports RSS Feed.

Like us on FacebookFollow us on TwitterView our profile on LinkedInFind us on Google+Cannon Trading Futures Trading Resistance & Support Levels and Economic ReportsFind us on Yelp

1. Market Commentary
2. Futures Support and Resistance Levels – S&P, Nasdaq, Dow Jones, Russell 2000, Dollar Index
3. Commodities Support and Resistance Levels – Gold, Euro, Crude Oil, T-Bonds
4. Commodities Support and Resistance Levels – Corn, Wheat, Beans, Silver
5. Futures Economic Reports for Friday April 29, 2016

Hello Traders,

For 2016 I would like to wish all of you discipline and patience in your trading!

Voted #1 futures trading blog!

Greetings!

The day after FOMC is many times the most important one for future direction of the markets…..On a correlated note, my short term outlook for gold as published on thestreet.com:Gold Futures Could Break Out — Here’s the Trading Strategy You Should Use

If you do need feedback, would like to chat/ consult with an experienced broker about any specific markets or strategies, feel free to contact us.

Featured System of the Month ( including real-time performance): Axiom Index II WFO NQ Trading System

Futures Market Outlook 4.26.2016

Connect with Us! Use Our Futures Trading Levels and Economic Reports RSS Feed.

Like us on FacebookFollow us on TwitterView our profile on LinkedInFind us on Google+Cannon Trading Futures Trading Resistance & Support Levels and Economic ReportsFind us on Yelp

1. Market Commentary
2. Futures Support and Resistance Levels – S&P, Nasdaq, Dow Jones, Russell 2000, Dollar Index
3. Commodities Support and Resistance Levels – Gold, Euro, Crude Oil, T-Bonds
4. Commodities Support and Resistance Levels – Corn, Wheat, Beans, Silver
5. Futures Economic Reports for Tuesday April 26, 2016

Hello Traders,

For 2016 I would like to wish all of you discipline and patience in your trading!

Voted #1 futures trading blog!

Greetings!

The week started out a little slow and on lower volume than normal as I think market awaits FOMC this Wednesday.

We do hve a few important reports tomorrow that may provide for some more movement ahead of the rate decision on Wednesday.

I do think that markets have patterns that repeat themselves, the question is when does it happen and how to act on it when it does and how to protect yourself when it does not.

There are certain days of the week, certain days with reports that can increase chances for behavior one way or another. Sometimes just knowing when we have higher chances for higher volatility can help one be more prepared for the trading day.

I mentioned before about crude oil trading extra volatile right around 8 Am and 1:15 PM central time ( right around the open of the old pit and before the close of the old pit). There are days when energies may have some very large moves during these last 15 minutes.

Continue reading “Futures Market Outlook 4.26.2016”

Using Tick and Volume Charts for Future Day Traders 4.22.2016

Connect with Us! Use Our Futures Trading Levels and Economic Reports RSS Feed.

Like us on FacebookFollow us on TwitterView our profile on LinkedInFind us on Google+Cannon Trading Futures Trading Resistance & Support Levels and Economic ReportsFind us on Yelp

1. Market Commentary
2. Futures Support and Resistance Levels – S&P, Nasdaq, Dow Jones, Russell 2000, Dollar Index
3. Commodities Support and Resistance Levels – Gold, Euro, Crude Oil, T-Bonds
4. Commodities Support and Resistance Levels – Corn, Wheat, Beans, Silver
5. Futures Economic Reports for Friday April 22, 2016

Hello Traders,

For 2016 I would like to wish all of you discipline and patience in your trading!

Voted #1 futures trading blog!

Greetings!

Why I like to use tick and volume charts for scalping

Today I decided to touch more on an educational feature rather than provide a certain market outlook.

Many of my clients and blog readers know that when it comes to short term trading I am a fan of using volume charts, tick charts, range bar charts and Renko charts rather than the traditional time charts like the 1 minutes, 5 minutes etc.

My rule of thumb is that if you as a trader make decisions based on charts that are less than 15 minutes time frame, it may be worth your time to research, back test and do some homework as to potentially using other type of charts like volume charts , Range charts etc.

Volume charts will draw a new bar once a user defined number of contracts traded. Example mini SP 10,000 volume chart will draw a new bar once 10,000 contracts traded.

Range bar charts will draw new charts once price action has exceeded a user pre define price or ticks range. Example might be an 18 ticks range bar chart on crude oil.

Continue reading “Using Tick and Volume Charts for Future Day Traders 4.22.2016”

Futures Support and Resistant Levels 4.19.2016

Connect with Us! Use Our Futures Trading Levels and Economic Reports RSS Feed.

Like us on FacebookFollow us on TwitterView our profile on LinkedInFind us on Google+Cannon Trading Futures Trading Resistance & Support Levels and Economic ReportsFind us on Yelp

1. Market Commentary
2. Futures Support and Resistance Levels – S&P, Nasdaq, Dow Jones, Russell 2000, Dollar Index
3. Commodities Support and Resistance Levels – Gold, Euro, Crude Oil, T-Bonds
4. Commodities Support and Resistance Levels – Corn, Wheat, Beans, Silver
5. Futures Economic Reports for Tuesday April 19, 2016

Hello Traders,

For 2016 I would like to wish all of you discipline and patience in your trading!

Voted #1 futures trading blog!

Greetings!

Not much to say after a long weekend.

Hopefully will have some words of wisdom to share tomorrow. ( the same applies for trading…no trade is better than a bad trade…)

Featured System of the Month ( including real-time performance): Axiom Index II WFO NQ Trading System

Heikin-Ashi Mini Russell 2000 Chart 4.14.2016

Connect with Us! Use Our Futures Trading Levels and Economic Reports RSS Feed.

Like us on FacebookFollow us on TwitterView our profile on LinkedInFind us on Google+Cannon Trading Futures Trading Resistance & Support Levels and Economic ReportsFind us on Yelp

1. Market Commentary
2. Futures Support and Resistance Levels – S&P, Nasdaq, Dow Jones, Russell 2000, Dollar Index
3. Commodities Support and Resistance Levels – Gold, Euro, Crude Oil, T-Bonds
4. Commodities Support and Resistance Levels – Corn, Wheat, Beans, Silver
5. Futures Economic Reports for Thursday April 14, 2016

Hello Traders,

For 2016 I would like to wish all of you discipline and patience in your trading!

Voted #1 futures trading blog!

Greetings!

If you must play, decide on three things at the start: the rules of the game, the stakes, and the quitting time…Chinese Proverb 

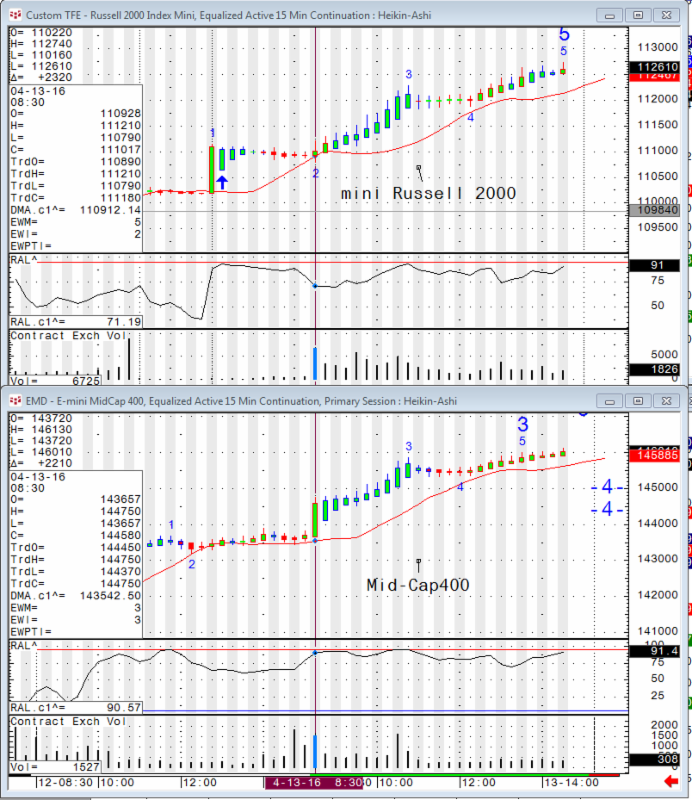
So more clients have asked about ICE, the mini Russell and the 110 per month the exchange is now charging for data….To be honest, for most clients I don’t think it’s worth it to pay that fee when you have other markets that can be an alternative to the mini Russell.One of them is the mid-cap 400, EMD, which trades on the CME, is the same tick size and behaves similar to the mini Russell. Volume is still light but worth exploring.

Below you will see two charts, mini Russell 15 minutes charts from today and 15 minutes chart of the Mid-cap 400 from today.

If you need any feedback, have questions, feel free to reply to this email or call us at 800-454-9572

Heikin-Ashi Mini Russell 2000 Chart

Featured System of the Month ( including real-time performance): Axiom Index II WFO NQ Trading System

Continue reading “Heikin-Ashi Mini Russell 2000 Chart 4.14.2016”

Levels of Resistance on a Crude Oil & Mini S&P Daily Chart 4.13.2016

Connect with Us! Use Our Futures Trading Levels and Economic Reports RSS Feed.

Like us on FacebookFollow us on TwitterView our profile on LinkedInFind us on Google+Cannon Trading Futures Trading Resistance & Support Levels and Economic ReportsFind us on Yelp

1. Market Commentary
2. Futures Support and Resistance Levels – S&P, Nasdaq, Dow Jones, Russell 2000, Dollar Index
3. Commodities Support and Resistance Levels – Gold, Euro, Crude Oil, T-Bonds
4. Commodities Support and Resistance Levels – Corn, Wheat, Beans, Silver
5. Futures Economic Reports for Wednesday April 13, 2016

Hello Traders,

For 2016 I would like to wish all of you discipline and patience in your trading!

Greetings!

If you must play, decide on three things at the start: the rules of the game, the stakes, and the quitting time…Chinese Proverb

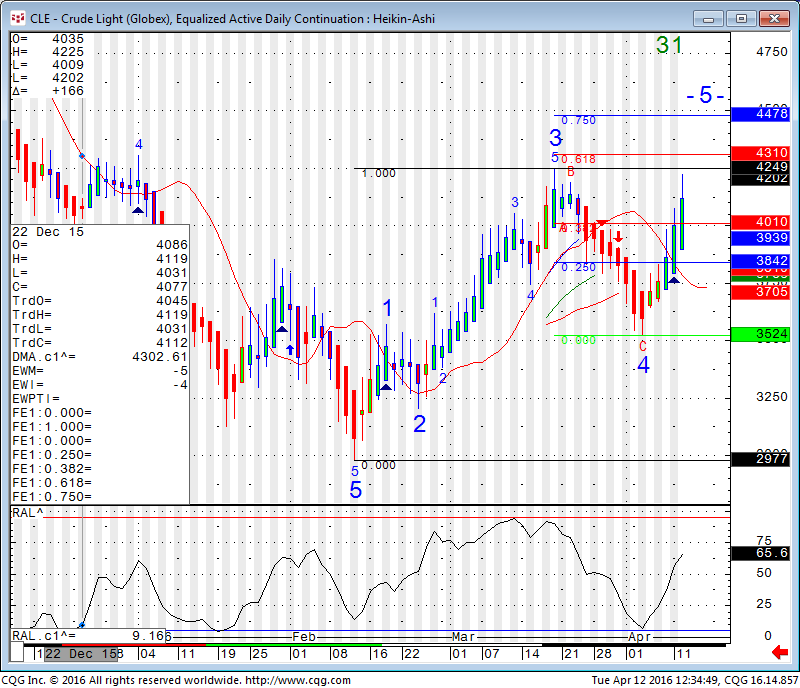
After a few days with very little reports (yet still some volatility in the markets) tomorrow we will have a few big reports including CPI, Beige Book and crude inventories.

Two charts below for your review: Daily Crude Oil chart, where we are heading into a few levels of resistance:

FOMC Minutes, ES & Gold 1 Minute Charts 4.06.2016

Connect with Us! Use Our Futures Trading Levels and Economic Reports RSS Feed.

Like us on FacebookFollow us on TwitterView our profile on LinkedInFind us on Google+Cannon Trading Futures Trading Resistance & Support Levels and Economic ReportsFind us on Yelp

1. Market Commentary
2. Futures Support and Resistance Levels – S&P, Nasdaq, Dow Jones, Russell 2000, Dollar Index
3. Commodities Support and Resistance Levels – Gold, Euro, Crude Oil, T-Bonds
4. Commodities Support and Resistance Levels – Corn, Wheat, Beans, Silver
5. Futures Economic Reports for Wednesday April 6, 2016

Hello Traders,

For 2016 I would like to wish all of you discipline and patience in your trading!

Greetings!

FOMC minutes tomorrow.

Below are 1 minute ES chart and 1 minute Gold chart for reference from the last FOMC minutes around the time of release:

ES Chart:

ES Chart

Continue reading “FOMC Minutes, ES & Gold 1 Minute Charts 4.06.2016”