In this post:
1. Market Commentary
2. Support and Resistance Levels
3. Hourly Futures chart of PIT big S&P500
4. Economic Reports
5. Highlighted Earnings Releases

1. Market Commentary
Market came back from a long weekend with extra energy and extra volatility.
We gaped lower to start the session and then bounced most of the day after better than expected ISM.
At this point, there more than a few gaps on the daily chart to be filled in both directions.
I am looking at a “band” between 1183 and 1136 as we go into tonight’s and tomorrow session.
To be honest, I don’t have a feel on which way to play the market outside of day-trading set ups right now.
I share these set ups, like the one below using the hourly chart in my daily, live signals service.
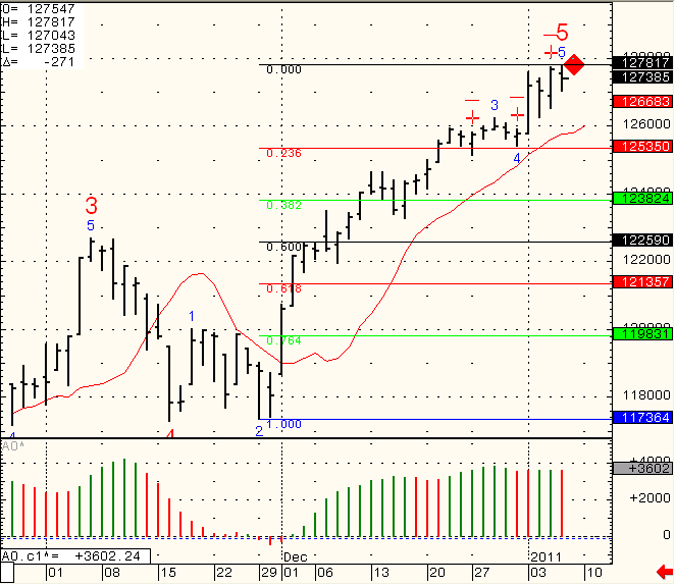
Hourly chart of PIT (big SP500) for your review below: Continue reading “More Volatitity after Holiday Weekend | Support and Resistance Levels”
