Trading Levels and Reports for October 2, 2012

Jump to a section in this post:

1. Market Commentary
2. Support and Resistance Levels – S&P, Nasdaq, Dow Jones, Russell 2000, Dollar Index
3. Support and Resistance Levels – Gold, Euro, Crude Oil, T-Bonds
4. Support and Resistance Levels – Corn, Wheat, Beans, Silver
5. Economic Reports for Tuesday October 2, 2012


Hello Traders,

Reading Supply & Demand: What is the Smart Money Doing?

Join us for a Webinar on October 2

Space is limited.
Reserve your Webinar seat now at:
https://www2.gotomeeting.com/register/578793218

Join us for a trading webinar with my colleague Thomas DeLello over at OrderFlowEdge.com who has traded Futures for  the past 16 years.

The Futures training webinar will take place on
Tuesday, October 2nd at 3:15 p.m. CST where Thomas will demonstrate
exactly how he uses ‘Order Flow’ and specific trading ‘Zones’ to
identify where the Smart and Big Money is moving in the market.

During his training webinar, you will discover:

– How he uses the Supply and Demand imbalance to create his
market map. (Don’t know what ‘Supply and Demand imbalance’ is yet?
Don’t worry, you will by the end of this training webinar!)

– How to ‘read’ the Supply and Demand Zones to know where the
reaction is expected to occur to ‘correct’ the imbalance in the market.

– How to leverage where the Smart and Big Money is for possible better trade set ups


SEATS ARE LIMITED, SO DON’T MISS THIS SPECIAL FREE WEBINAR!

Risk: Trading Futures, Options on Futures, and retail off-exchange foreign currency transactions involves substantial risk of loss and is not suitable for all investors. You should carefully consider whether trading is suitable for you in light of your circumstances, knowledge, and financial resources. You may lose all or more of your initial investment. Opinions, market data, and recommendations are subject to change at any time.

Title: Reading Supply & Demand: What is the Smart Money Doing?
Date: Tuesday, October 2, 2012
Time: 1:15 PM – 2:00 PM PDT


Be patient and stay disciplined.

Trading Levels and Reports for 9-28-2012

Jump to a section in this post:

1. Market Commentary
2. Support and Resistance Levels – S&P, Nasdaq, Dow Jones, Russell 2000, Dollar Index
3. Support and Resistance Levels – Gold, Euro, Crude Oil, T-Bonds
4. Support and Resistance Levels – Corn, Wheat, Beans, Silver
5. Economic Reports for Friday September 28, 2012


Hello Traders,

Last trading day of the month is tomorrow.

I thought the following reading by my colleague would be of interest:


Ranking 30 Market Events

Where do I look and when do I pay attention?

By Justin Smith, Cannon Trading Commodities Broker

separator 620

Every trader has done it. You’ve done it, your friends have done it, even your broker has done it at one point early in their career.

Here’s the scenario:

You’ve finally finished your futures education at Cannon Trading Company. You’ve done you’re homework on stops, limits, indicators and price movements for the market you’re trading. You’re ready to go, you enter your limit order and you wait.

separator 620

**DING**


Read the rest at:

https://www.cannontrading.com/community/man-vs-markets-futures-trading-blog


Be patient and stay disciplined.

Trading Levels and Reports for September 25, 2012

Jump to a section in this post:

1. Market Commentary
2. Support and Resistance Levels – S&P, Nasdaq, Dow Jones, Russell 2000, Dollar Index
3. Support and Resistance Levels – Gold, Euro, Crude Oil, T-Bonds
4. Support and Resistance Levels – Corn, Wheat, Beans, Silver
5. Economic Reports for Tuesday September 25, 2012


Hello Traders,

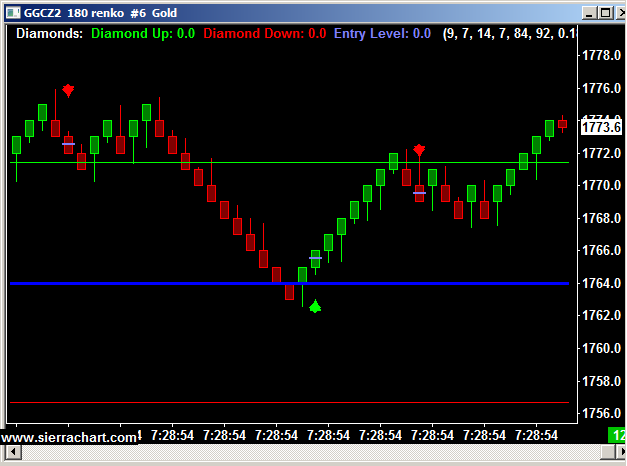
Screen shot from todays “live trading signals” session of the mini Russell 2000 below for your review.


During this daily screen sharing, I have my screen up for live viewing along with several charts of different markets. The charts include potential buy/ sell signals along with possible targets/ stops etc.


While there is rarely any voice commentary, i do answer questions during these sessions


The charts include some of my proprietry studies and ALGO I have developed that look for “turning points” in the markets on a day-trading basis.


I offer a two week trial period where one can get a daily invitation to view my charts running live AND/OR install the custom indicators on their own SIERRA charts so it can be applied to different markets and different time frames.


The trial is free. If one decides to subscribe to the service, the cost is $119 per month if you are a client of Cannon trading and $199 per month if you are not a client.


Mini Russell 2000 Intraday chart September 24,2012


Trading Levels and Reports for September 19, 2012

Jump to a section in this post:

1. Market Commentary
2. Support and Resistance Levels – S&P, Nasdaq, Dow Jones, Russell 2000, Dollar Index
3. Support and Resistance Levels – Gold, Euro, Crude Oil, T-Bonds
4. Support and Resistance Levels – Corn, Wheat, Beans, Silver
5. Economic Reports for Thursday September 19, 2012


Hello Traders,

Front month for Stock index futures, CURRENCIES, FINANCIALS is DECEMBER, symbol for December is Z.

ESZ2, NQZ2 etc.

Big move down on crude oil today. Daily chart along with WEEKLY support and resistance levels for your review below.

Notice that the next target on this leg down IF we pick some more downside speed is 86. 62


crude oil daily

Trading Levels and Reports for September 19, 2012

Jump to a section in this post:

1. Market Commentary
2. Support and Resistance Levels – S&P, Nasdaq, Dow Jones, Russell 2000, Dollar Index
3. Support and Resistance Levels – Gold, Euro, Crude Oil, T-Bonds
4. Support and Resistance Levels – Corn, Wheat, Beans, Silver
5. Economic Reports for Wednesday September 18, 2012


Hello Traders,

Front month for Stock index futures, CURRENCIES, FINANCIALS is DECEMBER.  The symbol for December is Z.

ESZ2, NQZ2 etc.

SIlver, copper and gold chart below are also December.

Below is a screen shot from today’s trading session and reflects potential buy/sell signals I share with clients and interested prospects.

If you like to observe the charts in realtime sign up at:

https://www.cannontrading.com/tools/intraday-futures-trading-signals


1347997769359

Trading Levels and Reports for September 14, 2012

Jump to a section in this post:

1. Market Commentary
2. Support and Resistance Levels – S&P, Nasdaq, Dow Jones, Russell 2000, Dollar Index
3. Support and Resistance Levels – Gold, Euro, Crude Oil, T-Bonds
4. Support and Resistance Levels – Corn, Wheat, Beans, Silver
5. Economic Reports for Friday September 14, 2012


Hello Traders,

Front month for Stock index futures is DECEMBER, symbol for December is Z.

ESZ2, NQZ2 etc.

Big move today after FOMC. many times the real reaction for FOMC will take place the following day. I will be watching carefuly.

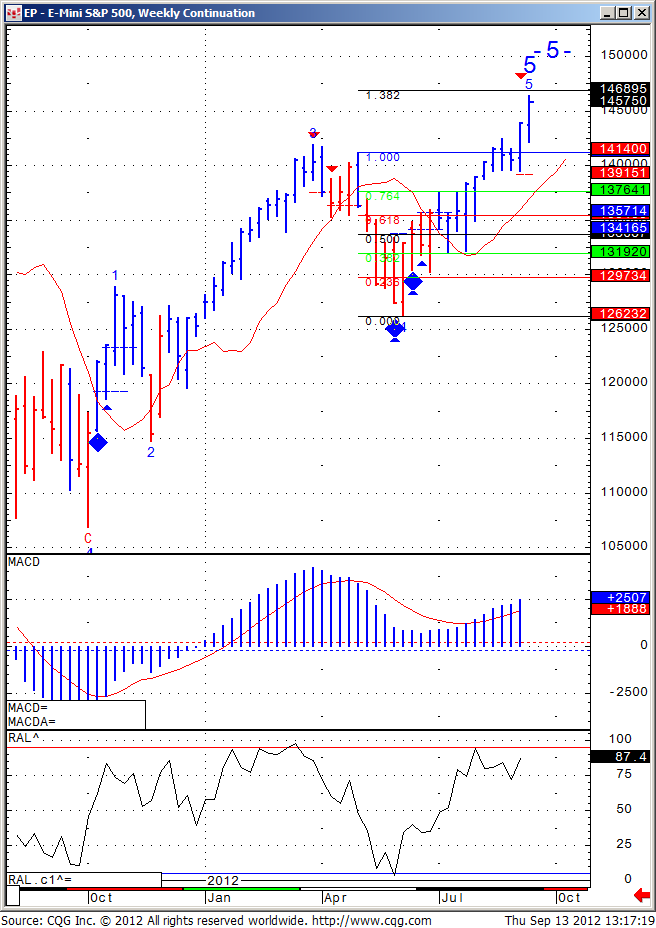
Weekly chart of mini SP 500 for your review below.

Trading Levels and Reports for September 13, 2012

Jump to a section in this post:

1. Market Commentary
2. Support and Resistance Levels – S&P, Nasdaq, Dow Jones, Russell 2000, Dollar Index
3. Support and Resistance Levels – Gold, Euro, Crude Oil, T-Bonds
4. Support and Resistance Levels – Corn, Wheat, Beans, Silver
5. Economic Reports for Thursday September 13, 2012


Hello Traders,

Rollover Notice for Stock Index Futures

Important notice: For those of you trading any stock index futures contracts, i.e., the E-mini S&P, E-mini NASDAQ, E-mini Dow Jones, the “Big” pit-traded S&P 500, etc., it is extremely important to remember that tomorrow, Thursday, September 13th, is rollover day.

Starting September 13th, the December 2012 futures contracts will be the front month contracts. It is recommended that all new positions be placed in the December 2012 contract as of September. Volume in the September 12 contracts will begin to drop off until its expiration on Friday September 21st.

The month code for December is Z2.

Traders with electronic trading software should make sure that defaults reflect the proper contract as of Thursday morning.

Trading Levels and Reports for September 12, 2012

Jump to a section in this post:

1. Market Commentary
2. Support and Resistance Levels – S&P, Nasdaq, Dow Jones, Russell 2000, Dollar Index
3. Support and Resistance Levels – Gold, Euro, Crude Oil, T-Bonds
4. Support and Resistance Levels – Corn, Wheat, Beans, Silver
5. Economic Reports for Wednesday September 12, 2012


Hello Traders,

Floor Opens at 7:20 a.m. CT for CBOT Grains and Oilseeds
Wednesday, September 12, 2012

Floor trading for CBOT Grain and Oilseed futures and options will open at 7:20 a.m. CT on Wednesday, September 12 due to the release of two major USDA reports: Crop Production and World Agricultural Supply and Demand Estimates


Electronic grains will be open before and during the reports which come out at 7:30 Am central time.


Gold started moving a couple of weeks ago, so I thought sharing of the weekly chart is appropriate.
gold futures weekly chart