Good Friday Holiday Trading Schedule

All hours are in central time.

The below calendar is compiled from sources believed to be reliable. Cannon Trading assumes no responsibility for any errors or omissions. It is meant as an alert to events that may affect trading strategies and is not necessarily complete. The closing times for certain contracts may have been rescheduled

Thursday, April 5

NYMEX (Floor)
Regular Close

GLOBEX
1:55 pm Close: Lumber, Dairy and Livestock products
*All other products regular close

ICE
Regular Close

EUREX
Regular Close

OneChicago
Regular Close

NYSE
Regular Close

Nadex
Regular Close

Forex
Regular Close

Continue reading “Good Friday Holiday Trading Schedule”

Wednesday Morning Support and Resistance

Here’s a morning cup o’ joe for all you futures traders, our morning support and resistance levels. Good trading!

divider black 190

Support and Resistance Levels – S&P 500, Nasdaq 100, Dow Jones, Mini Russell 2000, 30-Year US Bond, 10-Year US Note

Contract (June) Mini S&P 500 Mini Nasdaq 100 Dow Jones Mini Russell 2000 30-Year US Bond 10-Year US Note
Resistance Level 3 —————————————— Resistance Level 2 ——————————————

Resistance Level 1

——————————————

Support Level 1

——————————————

Support Level 2

——————————————

Support Level 3

1409.251404


1401


1395.5


1387.75


1380.5

27922777


2769


2751


2737


2711

1314313092


13062


13006


12965


12932

831.3826.5


823.8


819


817.2


809.3

1380313725


13714


13622


13612


13505

1300212918


12914


12906


12900.5


12824.5

Continue reading “Wednesday Morning Support and Resistance”

Tuesday Morning Support and Resistance Numbers

Here’s a morning cup o’ joe for all you futures traders, our morning support and resistance levels. Good trading!

divider black 190

Support and Resistance Levels – S&P 500, Nasdaq 100, Dow Jones, Mini Russell 2000, 30-Year US Bond, 10-Year US Note

Contract (June) Mini S&P 500 Mini Nasdaq 100 Dow Jones Mini Russell 2000 30-Year US Bond 10-Year US Note
Resistance Level 3 —————————————— Resistance Level 2 —————————————— Resistance Level 1

——————————————

Support Level 1

——————————————

Support Level 2

——————————————

Support Level 3

1428.51421 

1417.75


1405.75


1402


1398.25

27972790.25 

2784


2765


2754


2737

1331013245


13229


13128


13097


13065

850.6843


838.8


833.9


831.2


826.6

1392213905


13822


13705


13622


13505

1301913011.5


13002


12915.5


12905.5


12828.5

Continue reading “Tuesday Morning Support and Resistance Numbers”

Monday Morning Support and Resistance Numbers

Here’s a morning cup o’ joe for all you futures traders, our morning support and resistance levels. Good trading!

divider black 190

Support and Resistance Levels – S&P 500, Nasdaq 100, Dow Jones, Mini Russell 2000, 30-Year US Bond, 10-Year US Note

Contract (June) Mini S&P 500 Mini Nasdaq 100 Dow Jones Mini Russell 2000 30-Year US Bond 10-Year US Note
Resistance Level 3 —————————————— Resistance Level 2 ——————————————

Resistance Level 1

——————————————

Support Level 1

——————————————

Support Level 2

——————————————

Support Level 3

1428.51421


1414.25


1401


1398.25


1395.5

27972790.25


2773


2737


2726


2711

1331013245


13197


13108


13081


13053

834.8831.1


826.9


819


816.2


811.2

1390513813


13806


13705


13622


13505

1301913002


12926


12905.5


12828.5


12819

Continue reading “Monday Morning Support and Resistance Numbers”

Market Weel Wrap Up | Support and Resistance Levels

Jump to a section in this post:
1. Market Commentary
2. Support and Resistance Levels – S&P, Nasdaq, Dow Jones, Russell 2000
3. Support and Resistance Levels – Gold, Euro, Crude Oil, T-Bonds
4. Support and Resistance Levels – March Corn, March Wheat, Jan Beans, March Silver
5.Economic Report for April 2, 2012

Hello Traders,

Wishing all of you a great trading month in April.

May your trading have PATIENCE and DISCIPLINE!!

Market Week Wrap-up provided by www.TradeTheNews.com

– The final week of trading in the first quarter was subdued, as analysts celebrated just how well the stock market performance has been over the last three months. European stocks were had their best quarter since 2009, up 7%, while Japan’s Nikkei index rose nearly 20% in the quarter, for its best performance in 24 years. MSCI’s benchmark emerging equity index was up 13.7% on the year. In the US, the S&P500 rose 12%, for its best quarterly performance since Q3 2009, while the DJIA had its best Q1 since 1998. After the big run up in the quarter, investors continue to wonder how sustainable the rally really is and where the fuel for more upside will come from. Market mavens are still betting the Fed will cart out QE3 in the months ahead and in comments this week Chairman Bernanke affirmed accommodative policy must continue. He noted that though the data is getting more encouraging the recovery is not yet self sustaining, and that policy options remain on the table if things get worse. Final Q4 US GDP met most expectations at +3.0%, however there were some worrying signs in durables and other manufacturing numbers. Three regional Federal Reserve banks published much weaker than expected March manufacturing activity indices: data from the Dallas, Kansas City and Richmond Fed were notably weak, with poor showings in the new orders subcomponents. In addition, the March Chicago PMI survey was also soft. The February headline durable goods orders number was weaker than expected at +2.2%, hardly making up for January’s -3.6% figure. In Europe, German officials finally gave in to pressure and agreed to a stronger EFSF/ESM firewall fund, amounting to a grand total of €800B, just in time for heightened tensions in Spain, where the government insisted that it did not need to consider a bailout for its banking system or request access to emergency funds. In energy markets, crude prices fell as western power continued consultations on releasing strategic reserves should the Iran situation worsen. WTI crude, which nearly hit $109 last week, was down to $103 by Friday. Equity weakness in China helped lower prices for industrial metals somewhat, although copper prices still closed out Q1 up 11%. The DJIA, S&P500 and the Nasdaq all rose approximately 1% on the week. Continue reading “Market Weel Wrap Up | Support and Resistance Levels”

Friday Morning Support and Resistance Numbers

Here’s a morning cup o’ joe for all you futures traders, our morning support and resistance levels. Good trading!

divider black 190

Support and Resistance Levels – S&P 500, Nasdaq 100, Dow Jones, Mini Russell 2000, 30-Year US Bond, 10-Year US Note

Contract (June) Mini S&P 500 Mini Nasdaq 100 Dow Jones Mini Russell 2000 30-Year US Bond 10-Year US Note
Resistance Level 3 —————————————— Resistance Level 2 ——————————————

Resistance Level 1

——————————————

Support Level 1

——————————————

Support Level 2

——————————————

Support Level 3

14211414.25


1407


1398.75


1394


1386.25

27972790.25


2770


2750


2741


2711

1324513177


13138


13074


13032


12965

850.6838.5


834.8


829.5


825.5


819

1392613922


13905


13805


13720


13622

1301913011.5


13001.5


12915


12905


12828

Continue reading “Friday Morning Support and Resistance Numbers”

Intraday Chart | Support and Resistance Levels

Jump to a section in this post:
1. Market Commentary
2. Support and Resistance Levels – S&P, Nasdaq, Dow Jones, Russell 2000
3. Support and Resistance Levels – Gold, Euro, Crude Oil, T-Bonds
4. Support and Resistance Levels – March Corn, March Wheat, Jan Beans, March Silver
5.Economic Report for March 29, 2012

Hello Traders,

Gold front month is now JUNE. make sure you stop trading April and start trading June Gold.

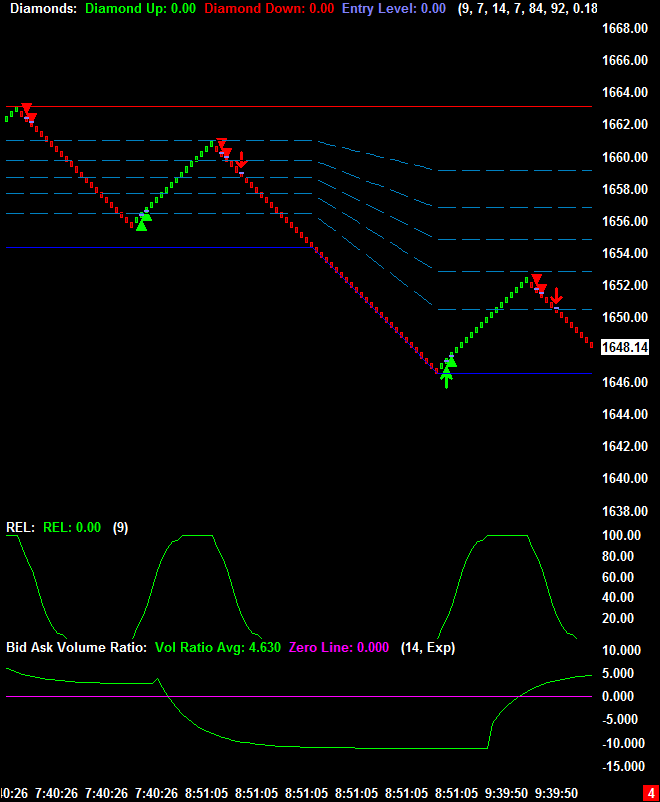
Talking about gold, below you will see my intraday chart set up for gold along with my own settings, ALGO and studies I like to use for daytrading gold.

552 Continue reading “Intraday Chart | Support and Resistance Levels”

Thursday Morning Support and Resistance

Here’s a morning cup o’ joe for all you futures traders, our morning support and resistance levels. Good trading!

divider black 190

Support and Resistance Levels – S&P 500, Nasdaq 100, Dow Jones, Mini Russell 2000, 30-Year US Bond, 10-Year US Note

Contract (June) Mini S&P 500 Mini Nasdaq 100 Dow Jones Mini Russell 2000 30-Year US Bond 10-Year US Note
Resistance Level 3 —————————————— Resistance Level 2 ——————————————

Resistance Level 1

——————————————

Support Level 1

——————————————

Support Level 2

——————————————

Support Level 3

14211409.25


1402.75


1395.5


1387.75


1380.5

28392797


2790


2750


2741


2711

1324513152


13095


13003


12932


12894

840.9834.8


831.4


825


817.2


809.3

1392613922


13902


13730


13715


13618

1301913001.5


12927


12901


12825


12817

Continue reading “Thursday Morning Support and Resistance”

Wednesday Morning Support and Resistance

Here’s a morning cup o’ joe for all you futures traders, our morning support and resistance levels. Good trading!

divider black 190

Support and Resistance Levels – S&P 500, Nasdaq 100, Dow Jones, Mini Russell 2000, 30-Year US Bond, 10-Year US Note

Contract (June) Mini S&P 500 Mini Nasdaq 100 Dow Jones Mini Russell 2000 30-Year US Bond 10-Year US Note
Resistance Level 3 —————————————— Resistance Level 2 —————————————— Resistance Level 1

——————————————

Support Level 1

——————————————

Support Level 2

——————————————

Support Level 3

14411421

1414


1404.75


1400.25


1395.5

28392797

2790


2769


2759


2741

1337613245

13195


13125


13088


13051

872850.2

845


835.5


830.9


826.3

1392613922

13822


13700


13621


13609

130191301.5

12922.5


12906.5


12830.5


12823

Continue reading “Wednesday Morning Support and Resistance”

Tuesday Morning Support and Resistance Numbers

Here’s a morning cup o’ joe for all you futures traders, our morning support and resistance levels. Good trading!

divider black 190

Support and Resistance Levels – S&P 500, Nasdaq 100, Dow Jones, Mini Russell 2000, 30-Year US Bond, 10-Year US Note

Contract (June) Mini S&P 500 Mini Nasdaq 100 Dow Jones Mini Russell 2000 30-Year US Bond 10-Year US Note
Resistance Level 3 —————————————— Resistance Level 2 —————————————— Resistance Level 1

——————————————

Support Level 1

——————————————

Support Level 2

——————————————

Support Level 3

14411429.25 

1421


1410


1404.75


1400.25

28392797 

2788


2758


2749


2740

1337613309 

13245


13166


13125


13088

872860 

850.6


841.3


836


831.3

1382213804 

13728


13700


13621


13609

13001.512920 

12910.5


12829.5


12823


12811

Continue reading “Tuesday Morning Support and Resistance Numbers”