10 Market Rules to Remember | Support and Resistance Levels

Jump to a section in this post:
1. Market Commentary
2. Support and Resistance Levels – S&P, Nasdaq, Dow Jones, Russell 2000
3. Support and Resistance Levels – Gold, Euro, Crude Oil, T-Bonds
4. Support and Resistance Levels – March Corn, March Wheat, Jan Beans, March Silver
5.Economic Report for March 27, 2012

Hello Traders,

Thought I would share the following with you as good , quick reading refresh…..

Bob Farrell was a legend at Merrill Lynch & Co. for several decades. Farrell had a front-row seat to the go-go markets of the late 1960s, mid-1980s and late 1990s, the brutal bear market of 1973-74, and October 1987’s crash.
He retired as chief stock market analyst at the end of 1992, but continued to occasionally publish.
Marketwatch gathered some of Farrell’s more famous observations, and republished them as “10 Market Rules to Remember.”
1. Markets tend to return to the mean over time
When stocks go too far in one direction, they come back. Euphoria and pessimism can cloud people’s heads. It’s easy to get caught up in the heat of the moment and lose perspective.
2. Excesses in one direction will lead to an opposite excess in the other direction
Think of the market baseline as attached to a rubber string. Any action to far in one direction not only brings you back to the baseline, but leads to an overshoot in the opposite direction.
3. There are no new eras — excesses are never permanent
Whatever the latest hot sector is, it eventually overheats, mean reverts, and then overshoots. Look at how far the emerging markets and BRIC nations ran over the past 6 years, only to get cut in half.
As the fever builds, a chorus of “this time it’s different” will be heard, even if those exact words are never used. And of course, it — Human Nature — never is different.
4. Exponential rapidly rising or falling markets usually go further than you think, but they do not correct by going sideways
Regardless of how hot a sector is, don’t expect a plateau to work off the excesses. Profits are locked in by selling, and that invariably leads to a significant correction — eventually. comes. Continue reading “10 Market Rules to Remember | Support and Resistance Levels”

Monday Morning Support and Resistance Numbers

Here’s a morning cup o’ joe for all you futures traders, our morning support and resistance levels. Good trading!

divider black 190

Support and Resistance Levels – S&P 500, Nasdaq 100, Dow Jones, Mini Russell 2000, 30-Year US Bond, 10-Year US Note

Contract (June) Mini S&P 500 Mini Nasdaq 100 Dow Jones Mini Russell 2000 30-Year US Bond 10-Year US Note
Resistance Level 3 —————————————— Resistance Level 2 ——————————————

Resistance Level 1

——————————————

Support Level 1

——————————————

Support Level 2

——————————————

Support Level 3

14111408


1404


1398


1395


1389.5

27812763


2750


2740


2734


2725

1322413160


13120


13073


13048


13004

848.3840.5


838.2


831.5


827.9


821.5

1382213804


13728


13700


13621


13609

13001.512920


12909.5


12822


12816


12810

Continue reading “Monday Morning Support and Resistance Numbers”

Friday Morning Support and Resistance Numbers

Here’s a morning cup o’ joe for all you futures traders, our morning support and resistance levels. Good trading!

divider black 190

Support and Resistance Levels – S&P 500, Nasdaq 100, Dow Jones, Mini Russell 2000, 30-Year US Bond, 10-Year US Note

Contract (June) Mini S&P 500 Mini Nasdaq 100 Dow Jones Mini Russell 2000 30-Year US Bond 10-Year US Note
Resistance Level 3 —————————————— Resistance Level 2 ——————————————

Resistance Level 1

——————————————

Support Level 1

——————————————

Support Level 2

——————————————

Support Level 3

14081398.25


1395.25


1382.5


1380.5


1372

27812763


2748.5


2704


2680


2659

1311813053


13017


12980


12951


12887

829.7826.4


823.1


818.8


812.1


805.4

1382213728


13715


13700


13622


13603

1292012910


12901


122817.5


12812.5


12807

Continue reading “Friday Morning Support and Resistance Numbers”

Thursday Morning Support and Resistance

Here’s a morning cup o’ joe for all you futures traders, our morning support and resistance levels. Good trading!

divider black 190

Support and Resistance Levels – S&P 500, Nasdaq 100, Dow Jones, Mini Russell 2000, 30-Year US Bond, 10-Year US Note

Contract (June) Mini S&P 500 Mini Nasdaq 100 Dow Jones Mini Russell 2000 30-Year US Bond 10-Year US Note
Resistance Level 3 —————————————— Resistance Level 2 ——————————————

Resistance Level 1

——————————————

Support Level 1

——————————————

Support Level 2

——————————————

Support Level 3

14081400


1395


1389.75


1380.5


1372

27492736


2730


2704


2680


2659

1313013073


13041


12980


12951


12887

840.5831.2


825.5


818.8


812.1


805.4

1382213728


13715


13627


13617


13601

1291012831


12825


12821


12816


12806.5

Continue reading “Thursday Morning Support and Resistance”

Crude Oil Chart | Support and Resistance Levels

Jump to a section in this post:
1. Market Commentary
2. Support and Resistance Levels – S&P, Nasdaq, Dow Jones, Russell 2000
3. Support and Resistance Levels – Gold, Euro, Crude Oil, T-Bonds
4. Support and Resistance Levels – March Corn, March Wheat, Jan Beans, March Silver
5.Economic Report for March 6, 2012
Hello Traders,

Another day of light economic reports ahead of us before we go into a stretch of 3 FULL days of important economic reports with the biggest ones on Friday, monthly unemployment and USDA for the grains.

I think that some days, the biggest challenge a day-trader may have is NOT taking trades when there are no set ups.

I know from experience and talking to clients, that here are days when there very few set ups if at all, but the day-trader feels he or she didn’t do their job because they did not take any trades….at that point, they will look for trades when normally he/she would not take that type of trades. That usually leads to negative results. While it may be frustrating not to have set ups you like, the disciplined trader will continue to wait patiently, as hard as it may be, knowing that “no trade, is better than a bad trade”. This is how I felt about today’s trading in stock indices for most of the day….

Crude Oil on the other hand, had a few good set ups and this is part of the reason I like to follow about 2-4 different markets for day trading. I try to pick markets from different segments, so I will look at either the mini SP or the mini Russell. I like the crude oil market and gold and at times I will take a look at one of the grain markets OR the Euro or any other market that has low correlation with the other ones I look at.

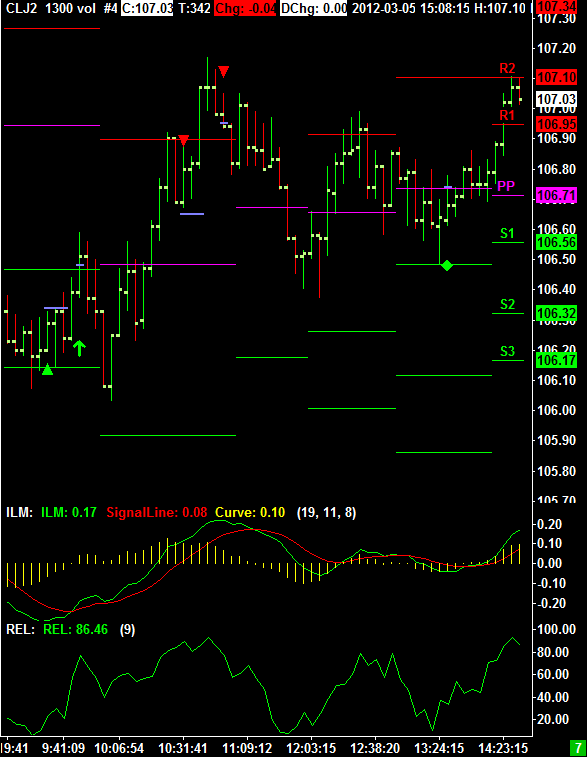
Below is a volume chart from today’s crude oil market using volume charts:

Market Commentary Continue reading “Crude Oil Chart | Support and Resistance Levels”

Tuesday Morning Support and Resistance

Here’s a morning cup o’ joe for all you futures traders, our morning support and resistance levels. Good trading!

divider black 190

Support and Resistance Levels – S&P 500, Nasdaq 100, Dow Jones, Mini Russell 2000, 30-Year US Bond, 10-Year US Note

Contract Mini S&P 500 (Mar) Mini Nasdaq 100 (Mar) Dow Jones (Mar) Mini Russell 2000 (Mar) 30-Year US Bond (June) 10-Year US Note (June)
Resistance Level 3——————————————Resistance Level 2 

——————————————

Resistance Level 1

——————————————

Support Level 1

——————————————

Support Level 2

——————————————

Support Level 3

1377.251367.5


1361.5


1350.5


1348


1332.5

26502628


2613


2583


2569


2563

1304212969


12925


12912


12973


12833

814.8809.9


804.3


793.8


784.60


769.2

1422514208


14123


14102


14021


13924

13128.513115


13109


13029


13022


13010

Continue reading “Tuesday Morning Support and Resistance”

Monday Morning Support and Resistance

Here’s a morning cup o’ joe for all you futures traders, our morning support and resistance levels. Good trading!

divider black 190

Support and Resistance Levels – S&P 500, Nasdaq 100, Dow Jones, Mini Russell 2000, 30-Year US Bond, 10-Year US Note

Contract Mini S&P 500 (Mar) Mini Nasdaq 100 (Mar) Dow Jones (Mar) Mini Russell 2000 (Mar) 30-Year US Bond (June) 10-Year US Note (June)
Resistance Level 3—————————————— Resistance Level 2——————————————

Resistance Level 1

——————————————

Support Level 1

——————————————

Support Level 2

——————————————

Support Level 3

1381.751377.25


1371


1366.5


1360.75


1355.5

26632650.25


2641


2623


2608


2596

1313313042


12985


12912


12973


12833

815.7811


805.6


792.20


784.60


769.2

1420814123


14105


14102


14021


13924

13128.513115


13109


13029


13022


13010

Continue reading “Monday Morning Support and Resistance”

Friday Morning Support and Resistance

Here’s a morning cup o’ joe for all you futures traders, our morning support and resistance levels. Good trading!

divider black 190

Support and Resistance Levels – S&P 500, Nasdaq 100, Dow Jones, Mini Russell 2000, 30-Year US Bond, 10-Year US Note

Contract Mini S&P 500 (Mar) Mini Nasdaq 100 (Mar) Dow Jones (Mar) Mini Russell 2000 (Mar) 30-Year US Bond (June) 10-Year US Note (June)
Resistance Level 3 —————————————— Resistance Level 2 ——————————————Resistance Level 1

——————————————

Support Level 1

——————————————

Support Level 2

——————————————

Support Level 3

1385.251381.75

1377


1366.5


1360.75


1355.5

26632653.25

2649


2623


2608


2596

1313313078

13042


12956


12913


12871

824.20820.70

817.1


806.5


801.4


783.20

1420814123

14105


14002


13924


13914

1310913103.5

13029.5


13020


13016.5


13010

Continue reading “Friday Morning Support and Resistance”

Strategy Runner Announcement | Support and Resistance Levels

Jump to a section in this post:
1. Market Commentary
2. Support and Resistance Levels – S&P, Nasdaq, Dow Jones, Russell 2000
3. Support and Resistance Levels – Gold, Euro, Crude Oil, T-Bonds
4. Support and Resistance Levels – March Corn, March Wheat, Jan Beans, March Silver
5.Economic Report for March 2, 2012
Hello Traders,

Cannon Trading is one of the few futures brokers still able to offer Strategy Runner to our clients, if you’re interested in trying a demo contact us today!

You can sign up for a free 30-day demo on our website: https://www.cannontrading.com/platform-strategy-runner.php

2. Support and Resistance Levels – S&P, Nasdaq, Dow Jones, Russell 2000

Contract (March 2012) SP500
(big & Mini)
Nasdaq100
(big & Mini)
Dow Jones
(big & Mini)
Mini Russell
Resistance Level 3 1384.40 2672.67 13086 841.70
Resistance Level 2 1379.70 2659.33 13052 832.70
Resistance Level 1 1376.10 2651.67 13008 823.50
Pivot Point 1371.40 2638.33 12974 814.50
Support Level 1 1367.80 2630.67 12930 805.30
Support Level 2 1363.10 2617.33 12896 796.30
Support Level 3 1359.50 2609.67 12852 787.10

Continue reading “Strategy Runner Announcement | Support and Resistance Levels”