Futures Levels and Economic Reports for 5.30.2014

Connect with Us! Use Our Futures Trading Levels and Economic Reports RSS Feed.

Like us on FacebookFollow us on TwitterView our profile on LinkedInFind us on Google+Cannon Trading Futures Trading Resistance & Support Levels and Economic ReportsFind us on Yelp

1. Market Commentary
2. Futures Support and Resistance Levels – S&P, Nasdaq, Dow Jones, Russell 2000, Dollar Index
3. Commodities Support and Resistance Levels – Gold, Euro, Crude Oil, T-Bonds
4. Commodities Support and Resistance Levels – Corn, Wheat, Beans, Silver
5. Futures Economic Reports for Friday May 30, 2014

Hello Traders,

For 2014 I would like to wish all of you discipline and patience in your trading!


US Bonds front month as of tomorrow is SEPTEMBER~  ZB U4.

FRONT month for gold  is AUGUST GC Q4 or GGC Q4.

Indices and Currencies are still trading the June contract.

Excellent and interesting resource for those of you who step out of the day-trading world, courtesy of www.MRCI.com :


http://www.mrci.com/special/correl.htm

Of course, one would expect gold and silver futures to move in tandem, to correlate closely, with each other. They’re both precious metals, aren’t they? But silver is also a by product of copper mining. Would they tend to trade together-or contrarily?

Similarly, one might expect price activity in Euros and T-bonds to be similar. Conversely, the Swiss Franc and the Dollar Index should have opposite reactions to the same market input.

A primary rationale behind the continuing bull market in stocks has been declining interest rates. How closely, in fact, have T-bond and SP500 futures tracked each other on a daily basis?

For years traders have made a very non-fundamental connection between the silver and soybean markets. How closely have they traded?

Heating oil and crude oil-yes. But live cattle and the J-Yen???

Some brief explanation is required. The singular relationship under consideration is the frequency of duplicated up/down daily closings. E.g., if Market A closed higher on Day 1, did also Market B? (In that respect, the study is qualitative, not quantitative, i.e., the amount is irrelevant.)

Without going into further details of least-squares and scatterplots, the precise statistical terminology that describes each relationship is a sample coefficient of correlation, a number greater than -1 and less than +1. Thus, if, every day over the sample period, each of two markets duplicated the other’s higher or lower closing, they would have a coefficient of correlation equal to 1/1, or +1. Conversely, two markets that always closed contrarily to each other would have a coefficient equal to -1. A 0 value indicates no correlation whatsoever. For convenience, however, all values in the spread sheet have been stated in terms of percentages of +1 or -1.

Remember, the amount of change is irrelevant, which can account for differences in trend.

Continue reading “Futures Levels and Economic Reports for 5.30.2014”

Futures Market Reports & Trading Levels 5.21.2014

Connect with Us! Use Our Futures Trading Levels and Economic Reports RSS Feed.

Like us on FacebookFollow us on TwitterView our profile on LinkedInFind us on Google+Cannon Trading Futures Trading Resistance & Support Levels and Economic ReportsFind us on Yelp

1. Market Commentary
2. Futures Support and Resistance Levels – S&P, Nasdaq, Dow Jones, Russell 2000, Dollar Index
3. Commodities Support and Resistance Levels – Gold, Euro, Crude Oil, T-Bonds
4. Commodities Support and Resistance Levels – Corn, Wheat, Beans, Silver
5. Futures Economic Reports for Wednesday May 21, 2014

Hello Traders,

For 2014 I would like to wish all of you discipline and patience in your trading!


I mentioned yesterday that we have good chances of higher volume / volatility move after the very low energy day we saw to start the week, and I was right (for a change (-:

SP500 finished down 14 points and traded about 1.5 million contracts, almost 60% more than we did on Monday.

We got a few more reports tomorrow morning followed by FOMC minutes (1 PM central)  which is a market MOVER event so my thought is that we may see some additional volatility tomorrow.


Why am I discussing this topic for two days in a row now?


I think that different types of trading days require different trading approaches/ strategies and if that you can assess quickly if this is a range bound day or more volatile / larger moves days EARLY enough, it may save you from trying to “average up/down” to soon or you may have better chances with break out strategies etc.


Continue reading “Futures Market Reports & Trading Levels 5.21.2014”

Low Volume across all Futures Markets & Economic Reports / Levels 5.20.2014

Connect with Us! Use Our Futures Trading Levels and Economic Reports RSS Feed.

Like us on FacebookFollow us on TwitterView our profile on LinkedInFind us on Google+Cannon Trading Futures Trading Resistance & Support Levels and Economic ReportsFind us on Yelp

1. Market Commentary
2. Futures Support and Resistance Levels – S&P, Nasdaq, Dow Jones, Russell 2000, Dollar Index
3. Commodities Support and Resistance Levels – Gold, Euro, Crude Oil, T-Bonds
4. Commodities Support and Resistance Levels – Corn, Wheat, Beans, Silver
5. Futures Economic Reports for Tuesday May 20, 2014

Hello Traders,

For 2014 I would like to wish all of you discipline and patience in your trading!


We started the week with very low volume, low energy type of trading across the markets.


Not my favorite conditions but that is part of trading….YOU need to adjust to what the market is doing, how the market is trading/ behaving since the opposite will NOT happen….mini SP volume looks to be under 1 million contracts today, which is well below the average volume.  If anything, days like today are sometimes followed by higher volatility/ higher volume days, so make sure to see what type of trading range/ volatility the overnight session had and how the first 30 minutes of trading tomorrow look like to see if it can help you asses the type of trading day ahead of you.


If you like the information we share? We would appreciate your positive reviews on our new yelp!! Continue reading “Low Volume across all Futures Markets & Economic Reports / Levels 5.20.2014”

Rally in the Cash Markets and Dow Jones Futures Daily Chart 5.13.2014

Connect with Us! Use Our Futures Trading Levels and Economic Reports RSS Feed.

Like us on FacebookFollow us on TwitterView our profile on LinkedInFind us on Google+Cannon Trading Futures Trading Resistance & Support Levels and Economic ReportsFind us on Yelp

1. Market Commentary
2. Futures Support and Resistance Levels – S&P, Nasdaq, Dow Jones, Russell 2000, Dollar Index
3. Commodities Support and Resistance Levels – Gold, Euro, Crude Oil, T-Bonds
4. Commodities Support and Resistance Levels – Corn, Wheat, Beans, Silver
5. Futures Economic Reports for Tuesday May 13, 2014

Hello Traders,

For 2014 I would like to wish all of you discipline and patience in your trading!


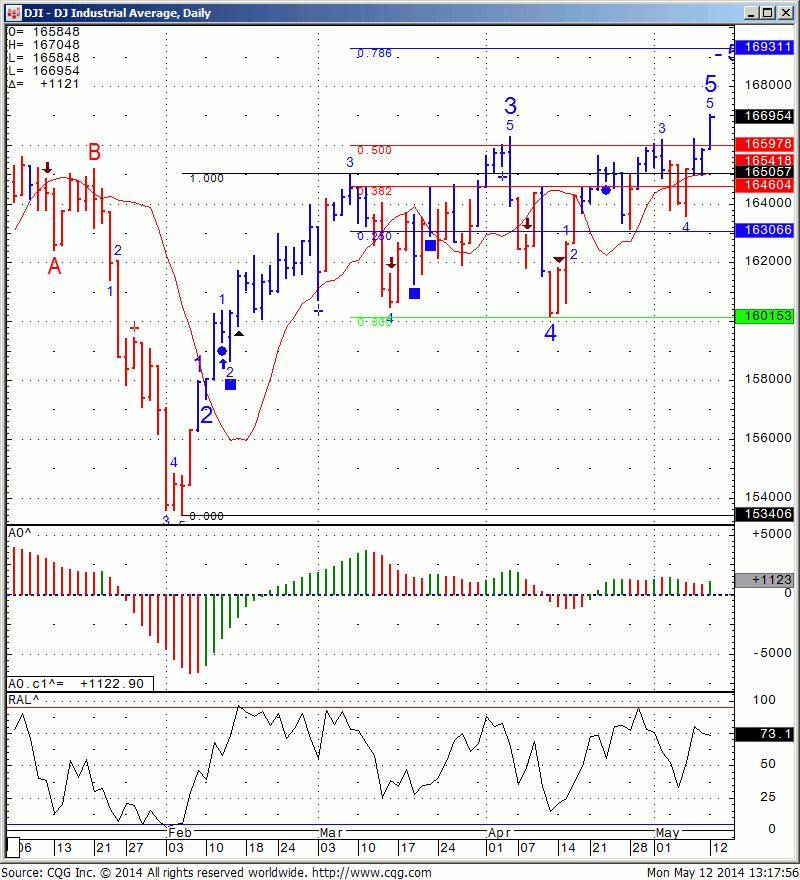
Must say this rally caught me off guard….

I am letting my rational mind do the thinking instead of my trading mind…..

My rational mind is asking “Why the heck are we trading where are, making all time highs?”

My trading mind is saying “Market found support and is resuming the path of least resistance….which is up”

For some reason when it comes to stock index futures I keep making the mistake of allowing my rational mind get in there.

I don’t do it with other markets…If crude is making a big move I use my “trading mind”, same with Natural Gas, gold etc. for some reason with stock index futures I tend to fight  and argue with the market and the market always wins….


Daily chart of the Dow Jones Cash index below for your review:


812


If you like the information we share? We would appreciate your positive reviews on our new yelp!! Continue reading “Rally in the Cash Markets and Dow Jones Futures Daily Chart 5.13.2014”

Futures Day Trading Money and Trade Management & Economic Reports 5.07.2014

Connect with Us! Use Our Futures Trading Levels and Economic Reports RSS Feed.

Like us on FacebookFollow us on TwitterView our profile on LinkedInFind us on Google+Cannon Trading Futures Trading Resistance & Support Levels and Economic ReportsFind us on Yelp

1. Market Commentary
2. Futures Support and Resistance Levels – S&P, Nasdaq, Dow Jones, Russell 2000, Dollar Index
3. Commodities Support and Resistance Levels – Gold, Euro, Crude Oil, T-Bonds
4. Commodities Support and Resistance Levels – Corn, Wheat, Beans, Silver
5. Futures Economic Reports for Thursday May 8, 2014

Hello Traders,

For 2014 I would like to wish all of you discipline and patience in your trading!


A few words on why I think discretionary, day traders should limit the number of hours they spend in front of the screen….

The longer you trade, the more chances you give the market to frustrate you, tire you and get you to a point where you can make mental mistakes that will cost you quite a bit….

My recommendation is to work your trading hours into your life style and not vice versa unless you are a professional trader that actually makes a living from trading….

Few ways one can try to preserve their “trading career”, almost like an athlete who should not play the full game, every game as he/ she increases wear and tear, risk of injury etc….


Place a time limit.

Set a daily profit target

Set a daily loss limit

Learn what reports or possibly times of the day are not as friendly to the market you are trading. It can be because of light volume, perhaps around certain trading reports etc.


Learn to step away and take a break, ESPECIALLY when things are not going the way you would like them to.


Have patience and discipline!


If you like the information we share? We would appreciate your positive reviews on our new yelp!! Continue reading “Futures Day Trading Money and Trade Management & Economic Reports 5.07.2014”

Futures Market Trading News & Economic Reports 5.06.2014

Connect with Us! Use Our Futures Trading Levels and Economic Reports RSS Feed.

Like us on FacebookFollow us on TwitterView our profile on LinkedInFind us on Google+Cannon Trading Futures Trading Resistance & Support Levels and Economic ReportsFind us on Yelp

1. Market Commentary
2. Futures Support and Resistance Levels – S&P, Nasdaq, Dow Jones, Russell 2000, Dollar Index
3. Commodities Support and Resistance Levels – Gold, Euro, Crude Oil, T-Bonds
4. Commodities Support and Resistance Levels – Corn, Wheat, Beans, Silver
5. Futures Economic Reports for Tuesday May 6, 2014

Hello Traders,

For 2014 I would like to wish all of you discipline and patience in your trading!


TradeTheNews.com Weekly Market Update: No Mayday for Steady Markets

Fri, 02 May 2014 16:28 PM EST- After a rough start for stocks in April, the DJIA and S&P500 erased 3% declines to end the month higher by about 0.5% a piece, at or near record highs. The moves for the Nasdaq were even more extreme, as investors backed out of a wide spectrum of high-flying technology and biotech stocks. This week volatility in US and European markets dried up and equities saw steady if modest gains. Excellent UK GDP data, good German jobs numbers, incremental gains in Eurozone inflation and the monster US April jobs report supported the positive tone, while the weak US GDP reading was overlooked. The FOMC policy meeting was the least impactful in some time, with no notable changes except Kocherlakota withdrawing his dissent (as expected). Nearly two-thirds of S&P500 companies have now reported quarterly earnings, and with a few exceptions most of corporate America is meeting or beating profit expectations, even if revenue growth has been clearly anemic. In Ukraine, Kiev’s offensive to reestablish control over its eastern provinces has more or less fallen flat and belligerent Russian rhetoric has only increased. On Monday, the US placed additional sanctions on a handful of Russian officials, none of whom were the chief actors in the Ukraine drama. For the week, the DJIA and the S&P500 each rose 0.9%, and the Nasdaq gained 1.2%.- Most analysts are shrugging off the +0.1% advance Q1 GDP reading, citing the well-worn excuse of unusually severe winter weather. The focus has been on the consumption component of the first reading of Q1 GDP, which was +3.0%, roundly beating expectations, bolstered by a 4.4% jump in spending on services. The latter was due to the expansion of healthcare spending under Obamacare. Note that domestic investment (both residential and nonresidential), trade and government spending subtracted much more from growth than anticipated.- The April jobs report greatly exceeded expectations with the 288K non-farm payrolls gain the strongest since January 2012. Gains were broad-based across sectors, including construction. Most importantly, nothing in the data suggests the increase in the payroll series was a statistical fluke. The same cannot be said for the unexpectedly steep decline in the unemployment rate to 6.3%. The three-tenths drop in joblessness did not reflect an increase in employment – as measured by the household survey employment actually fell by 73K – but rather the 806K workers reporting themselves as being out of the labor market, pushing the labor force participation rate down 0.4 points to 62.8%. Analysts highlight that this is a very noisy measure and will certainly be revised.

– Data out this week suggested that, like much else in the US economy, the housing industry will also bounce back from its winter weather slump. The pending home sales data saw its first positive m/m reading in nine months in March, widely beating expectations. Data out last week showed that existing home sales fell to their lowest levels in nearly two years in March, but the pending homes report suggests the downward trend may have run its course. While there is hope for further improvement in the housing market, it looks like there is little chance for housing reform in Washington, DC this year. The Senate Banking Committee scheduled an April 29th markup session for the GSE reform bill, but with committee work starting so late in the session there is little chance for much to get done before Congress shifts into full-on election mode.

– Federal prosecutors are planning criminal charges against BNP Paribas and Credit Suisse Group for separate alleged offenses, raising fears that one or both could possibly be forced out of the US market. The DoJ is seeking criminal charges against BNP for allegedly skirting economic sanctions against Iran, and charges against Credit Suisse for helping clients avoid taxes. Reportedly BNP faces charges of up to $2 billion, and while there are said to be discussions of ways to avoid revocation of the bank’s New York charter in case of a guilty verdict, the Fed still might move to take away its licenses. Elsewhere in the annals of financial misbehavior, Bank of America disclosed an embarrassing error in calculating its capital ratios, forcing it to suspend capital returns to shareholders and redo its CCAR submissions to the Fed.

– Rising crude and natural gas prices were the trend in the first quarter, although not all of the global oil majors benefitted equally from the improved pricing environment. ConocoPhillips and Exxon reported much better-than-expected first quarter results, although Exxon’s lower upstream production pulled profits down on a y/y basis while Conoco’s higher production boosted its profits. Both beat consensus EPS estimates. Meanwhile, Chevron missed both top- and bottom-line expectations as production fell 2% y/y and weaker refining margins hurt bottom-line results. BP’s profits slumped and revenue was down significantly as the company continues to shed assets. BP’s profit from its Rosneft joint venture shrank by 75% in the quarter thanks to the Ukraine crisis weakening the ruble.

– April auto sales were mixed. General Motor’s sales gained 6.9%, more than expected, Chrysler slightly topped expectations and Ford missed. A GM sales executive said retail demand was steady in the month as the economy continues to strengthen. Toyota and Nissan’s sales were very strong, up 13.3% y/y and 18.3% y/y, respectively. Ford was the only major auto firm to report a decline in monthly sales, however truck sales remained very strong, with overall April sales +8%, twice the March gain. In addition, Ford announced that CEO Alan Mulally would step down as chief on July 1st. Over his eight-year term, Mulally transformed Ford from a money-loser to a thriving firm. He will be replaced by Mark Fields, the current chief operating officer.

– Pharmaceutical industry deal making continued after last week’s big announcements. There were repeated reports that Allergan would make a second attempt to acquire Shire to fend off Valeant’s $46-billion unsolicited bid, or even try to sell the company to Johnson & Johnson or Sanofi. AstraZeneca disclosed this week that back in January, Pfizer had offered £46.61/share to acquire the firm was rebuffed, and that Pfizer had renewed its approach. On Friday, Pfizer hiked its offer for AstraZeneca to approximately £50.00/share, valuing the firm at more than $106B. Forest Laboratories said it would buy Furiex Pharmaceuticals for $1.5 billion to get access to its gastrointestinal disease treatments. In other deal news, the contest to acquire Alstom’s energy units is now between Siemens and General Electric, with bids said to be running around €11-12 billion.

– The eagerly awaited Eurozone April annualized CPI was slightly lower than expected, at +0.7% versus +0.8%e, while core was in-line at +1.0%. Recall that the March figure that really lit the fire under QE talk was a mere +0.5%, so the slight increase lent some credibility to ECB assertions that the Eurozone will avoid deflation. In a meeting with German legislators, President Draghi said there was still no chance of deflation in the Eurozone and that launching a QE program was only a distant possibility. EUR/USD traded in only a slightly broader range than last week, between 1.3800 and 1.3890.

– UK GDP saw its fifth consecutive quarter of growth in Q1, with the advance annualized figure at +3.1%, up from +2.7% in the final quarter of 2013. This was the highest annualized rate of growth seen in six years, and BoE Governor Carney said the data shows the UK is entering a sustainable recovery. GBP/USD hit a fresh 4-year highs above 1.6900 toward week’s end.

– The Bank of Japan held pat in its policy statement out this week and cut its GDP forecast for the FY14/FY15 period to +1.1% from +1.4% prior, and maintained its inflation outlook for the period. This marked one year since the bank launched its ambitious program to double the monetary base and achieve 2% inflation within two years. The March labor cash earnings report – a closely watched gauge of consumer “cost-push” inflation from salaries – moved to a two-year high of +0.7%, giving government officials a reason to celebrate Abenomics. However, the April Markit manufacturing PMI saw its first contraction in over a year, with both output and new export orders components in contraction as well. USD/JPY spent most of the week locked in the 102 handle, only briefly surging above 103 in the immediate aftermath of the US jobs report on Friday.


If you like the information we share? We would appreciate your positive reviews on our new yelp!!

GOOD TRADING

Trading Futures, Options on Futures, and retail off-exchange foreign currency transactions involves substantial risk of loss and is not suitable for all investors. You should carefully consider whether trading is suitable for you in light of your circumstances, knowledge, and financial resources. You may lose all or more of your initial investment. Opinions, market data, and recommendations are subject to change at any time.

If you like Our Futures Trading Daily Support and Resistance Levels, Please share!

Futures Trading Levels

Contract June 2014  SP500 (big & Mini) Nasdaq100 (big & Mini) Dow Jones (big & Mini) Mini Russell Dollar Index
Resistance 3 1904.50 3663.33 16700 1147.80 79.68
Resistance 2 1892.25 3630.67 16591 1137.60 79.63
Resistance 1 1885.00 3613.33 16524 1129.90 79.59
Pivot 1872.75 3580.67 16415 1119.70 79.54
Support 1 1865.50 3563.33 16348 1112.00 79.49
Support 2 1853.25 3530.67 16239 1101.80 79.44
Support 3 1846.00 3513.33 16172 1094.10 79.40
Contract June Gold July Silver June Crude Oil June Bonds  June Euro
Resistance 3 1333.9 2001.2 101.79 137  4/32 1.3906
Resistance 2 1324.8 1987.8 101.12 136 26/32 1.3896
Resistance 1 1317.8 1975.2 100.26 136  9/32 1.3885
Pivot 1308.7 1961.8 99.59 135 31/32 1.3875
Support 1 1301.7 1949.2 98.73 135 14/32 1.3864
Support 2 1292.6 1935.8 98.06 135  4/32 1.3854
Support 3 1285.6 1923.2 97.20 134 19/32 1.3843
Contract July Corn July Wheat July Beans July SoyMeal July bean Oil
Resistance 3 519.7 746.3 1480.17 488.80 41.41
Resistance 2 514.3 740.7 1476.08 486.50 41.36
Resistance 1 511.2 734.8 1469.67 482.60 41.26
Pivot 505.8 729.2 1465.58 480.30 41.21
Support 1 502.7 723.3 1459.2 476.4 41.1
Support 2 497.3 717.7 1455.08 474.10 41.06
Support 3 494.2 711.8 1448.67 470.20 40.96
5. Economic Reports

source:http://www.forexfactory.com/calendar.php

All times are Eastern time Zone (EST)

Date 4:06pm Currency Impact Detail Actual Forecast Previous Graph
TueMay 6  3:00am EUR Spanish Unemployment Change -49.1K -16.6K
3:15am EUR Spanish Services PMI 54.3 54.0
3:45am EUR Italian Services PMI 51.2 49.5
4:00am EUR Final Services PMI 53.1 53.1
5:00am EUR Retail Sales m/m -0.2% 0.4%
All Day EUR ECOFIN Meetings
8:30am USD Trade Balance -40.1B -42.3B
10:00am USD IBD/TIPP Economic Optimism 47.6 48.0
5:30pm USD FOMC Member Stein Speaks

This is not a solicitation of any order to buy or sell, but a current market view provided by Cannon Trading Inc. Any statement of facts here in contained are derived from sources believed to be reliable, but are not guaranteed as to accuracy, nor they purport to be complete. No responsibility is assumed with respect to any such statement or with respect to any expression of opinion herein contained. Readers are urged to exercise their own judgment in trading.

Monthly Unemployment #s tomorrow & Futures Economic Reports 5.02.2014

Connect with Us! Use Our Futures Trading Levels and Economic Reports RSS Feed.

Like us on FacebookFollow us on TwitterView our profile on LinkedInFind us on Google+Cannon Trading Futures Trading Resistance & Support Levels and Economic ReportsFind us on Yelp

1. Market Commentary
2. Futures Support and Resistance Levels – S&P, Nasdaq, Dow Jones, Russell 2000, Dollar Index
3. Commodities Support and Resistance Levels – Gold, Euro, Crude Oil, T-Bonds
4. Commodities Support and Resistance Levels – Corn, Wheat, Beans, Silver
5. Futures Economic Reports for Friday May 2, 2014

Hello Traders,

For 2014 I would like to wish all of you discipline and patience in your trading!


Monthly unemployment numbers tomorrow at 8:30 Am EST.

Definitely a market mover news release.


For most traders, I recommend staying out, letting the smoke clear before trying to trade – unless you feel like being a gambler or your strategy is built around big news events.


Some more experienced and more capitalized traders will sometime try to “play” big news events by placing sell orders quite a bit above the market and placing buy orders quite a bit below the market, looking for the market to get out of “norm” and then return to balance. For me personally too much risk and the moves can be too fast but then again each of us is different in terms of trading personality, trading capital, trading experience  and risk tolerance…..


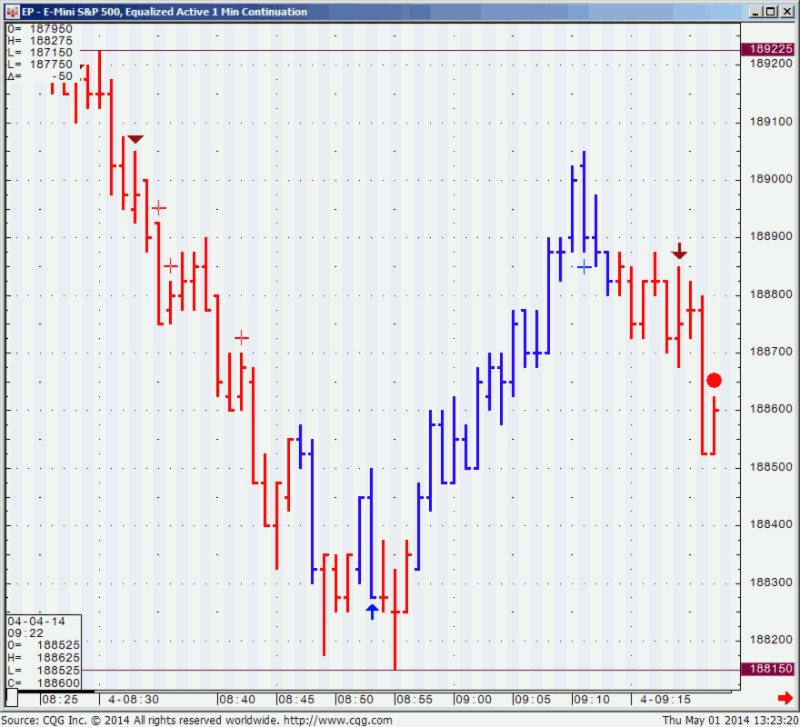
Below is a 1 minute chart of the mini SP from the last monthly unemployment numbers as a reference. Was not as volatile as previous reports but still 11 full points of swings in the first few minutes of trading.


808


If you like the information we share? We would appreciate your positive reviews on our new yelp!!

GOOD TRADING

Trading Futures, Options on Futures, and retail off-exchange foreign currency transactions involves substantial risk of loss and is not suitable for all investors. You should carefully consider whether trading is suitable for you in light of your circumstances, knowledge, and financial resources. You may lose all or more of your initial investment. Opinions, market data, and recommendations are subject to change at any time.

If you like Our Futures Trading Daily Support and Resistance Levels, Please share!

Futures Trading Levels

Contract June 2014  SP500 (big & Mini) Nasdaq100 (big & Mini) Dow Jones (big & Mini) Mini Russell Dollar Index
Resistance 3 1894.75 3639.67 16614 1157.17 79.76
Resistance 2 1888.75 3622.58 16575 1144.83 79.68
Resistance 1 1883.50 3604.67 16533 1134.37 79.63
Pivot 1877.50 3587.58 16494 1122.03 79.56
Support 1 1872.25 3569.67 16452 1111.57 79.51
Support 2 1866.25 3552.58 16413 1099.23 79.43
Support 3 1861.00 3534.67 16371 1088.77 79.38
Contract June Gold July Silver June Crude Oil June Bonds  June Euro
Resistance 3 1308.5 1987.0 101.10 137  7/32 1.3907
Resistance 2 1300.8 1956.0 100.50 136 18/32 1.3897
Resistance 1 1292.8 1930.5 99.95 136  2/32 1.3881
Pivot 1285.1 1899.5 99.35 135 13/32 1.3871
Support 1 1277.1 1874.0 98.80 134 29/32 1.3855
Support 2 1269.4 1843.0 98.20 134  8/32 1.3845
Support 3 1261.4 1817.5 97.65 133 24/32 1.3829
Contract July Corn July Wheat July Beans July SoyMeal July bean Oil
Resistance 3 522.9 718.0 1532.33 505.77 42.04
Resistance 2 519.3 715.8 1517.67 499.63 41.85
Resistance 1 513.2 711.5 1489.33 488.17 41.50
Pivot 509.6 709.3 1474.67 482.03 41.31
Support 1 503.4 705.0 1446.3 470.6 41.0
Support 2 499.8 702.8 1431.67 464.43 40.77
Support 3 493.7 698.5 1403.33 452.97 40.42
5. Economic Reports

source:http://www.forexfactory.com/calendar.php

All times are Eastern time Zone (EST)

Date 4:07pm Currency Impact Detail Actual Forecast Previous Graph
FriMay 2  3:15am EUR Spanish Manufacturing PMI 53.2 52.8
3:45am EUR Italian Manufacturing PMI 53.0 52.4
4:00am EUR Final Manufacturing PMI 53.3 53.3
5:00am EUR Unemployment Rate 11.9% 11.9%
8:30am USD Non-Farm Employment Change 216K 192K
USD Unemployment Rate 6.6% 6.7%
USD Average Hourly Earnings m/m 0.2% 0.0%
10:00am USD Factory Orders m/m 1.5% 1.6%

This is not a solicitation of any order to buy or sell, but a current market view provided by Cannon Trading Inc. Any statement of facts here in contained are derived from sources believed to be reliable, but are not guaranteed as to accuracy, nor they purport to be complete. No responsibility is assumed with respect to any such statement or with respect to any expression of opinion herein contained. Readers are urged to exercise their own judgment in trading.

Futures Trading Levels and Economic Reports for September 17, 2013

Connect with Us! Use Our Futures Trading Levels and Economic Reports RSS Feed.

Like us on FacebookFollow us on TwitterView our profile on LinkedInFind us on Google+Cannon Trading Futures Trading Resistance & Support Levels and Economic ReportsFind us on Yelp

1. Market Commentary
2. Futures Support and Resistance Levels – S&P, Nasdaq, Dow Jones, Russell 2000, Dollar Index
3. Commodities Support and Resistance Levels – Gold, Euro, Crude Oil, T-Bonds
4. Commodities Support and Resistance Levels – Corn, Wheat, Beans, Silver
5. Futures Economic Reports for Tuesday September 17, 2013

Hello Traders,

For 2013 I would like to wish all of you discipline and patience in your trading! 

Big moves took place last night when the markets reopened in reaction to news about Syria, but by the time the markets closed today, most of the markets went back to levels from Friday session, so we are still waiting to see the actual direction for many different markets. I am sure we will see some whipsaw both ways over the next few days.


In the field of day-trading, my tip for today is:


Try to limit the amount of time you are trying to day-trade as well as try to choose the RIGHT period of time during the day to day-trade.


I think the more hours one spends in front of the charts trading, the higher chances one has to be prone for mistakes, frustration and more.


The other part is to choose the right period of time in the day for the markets you trade. Different markets have different period of times during the day when they are more active, perhaps more volatile etc.


This also has to coincide with your schedule and other constraints.


You like the information we share? We would appreciate your positive reviews on Google+ , Facebook, Yelp etc…use the icons below to share, recommend, review us and more!

Like us on FacebookFollow us on TwitterView our profile on LinkedInFind us on Google+Cannon Trading Futures Trading Resistance & Support Levels and Economic ReportsFind us on Yelp

Rollover+ Trading Levels & Economic Reports for Sept. 13th 2013

Connect with Us! Use Our Futures Trading Levels and Economic Reports RSS Feed.

Like us on FacebookFollow us on TwitterView our profile on LinkedInFind us on Google+Cannon Trading Futures Trading Resistance & Support Levels and Economic ReportsFind us on Yelp

1. Market Commentary
2. Futures Support and Resistance Levels – S&P, Nasdaq, Dow Jones, Russell 2000, Dollar Index
3. Commodities Support and Resistance Levels – Gold, Euro, Crude Oil, T-Bonds
4. Commodities Support and Resistance Levels – Corn, Wheat, Beans, Silver
5. Futures Economic Reports for Friday September 13, 2013

Hello Traders,

For 2013 I would like to wish all of you discipline and patience in your trading! 

December is now the front month for stock index futures. The symbol for December is Z, so if you are trading the mini SP you need to start trading ESZ3.


Also currencies will switch over to December as of tomorrow, make sure you are careful as currencies can be assigned delivery notice after this Monday.


If you have any questions, please contact your broker.


You like the information we share? We would appreciate your positive reviews on Google+ , Facebook, Yelp etc…use the icons below to share, recommend, review us and more!

Like us on FacebookFollow us on TwitterView our profile on LinkedInFind us on Google+Cannon Trading Futures Trading Resistance & Support Levels and Economic ReportsFind us on Yelp