Economic Reports and Trading Levels for February 15, 2013


Jump to a section in this post:

1. Market Commentary
2. Support and Resistance Levels – S&P, Nasdaq, Dow Jones, Russell 2000, Dollar Index
3. Support and Resistance Levels – Gold, Euro, Crude Oil, T-Bonds
4. Support and Resistance Levels – Corn, Wheat, Beans, Silver
5. Economic Reports for Friday February 15, 2013


Hello Traders,

For 2013 I would like to wish all of you discipline and patience in your trading!

The continued “grind higher” in 45 degree angle continue in the stock index futures. Below is a daily chart of the March mini SP 500. I displayed my technical opinion along with possible upside levels and levels below in case of correction.

One thing I feel strong about, this period of extremely low volatility will be replaced with periods of high volatility. The big question is when….Until then, trade what the market gives you and what you hoping for.

mini sp 500 daily chart


Economic Reports and Trading Levels for February 13, 2013


Jump to a section in this post:

1. Market Commentary
2. Support and Resistance Levels – S&P, Nasdaq, Dow Jones, Russell 2000, Dollar Index
3. Support and Resistance Levels – Gold, Euro, Crude Oil, T-Bonds
4. Support and Resistance Levels – Corn, Wheat, Beans, Silver
5. Economic Reports for Wednesday February 13, 2013


Hello Traders,

For 2013 I would like to wish all of you discipline and patience in your trading!


State of the Union tonight should create volatility in the night session and may carry over to the day session.

The last two trading sessions had EXTREMELY low volatility and tight ranges, I suspect this may change tomorrow.


Cannon Futures News Center! Bookmark this page as your futures trading news source!


Economic Reports and Trading Levels for February 12, 2013


Jump to a section in this post:

1. Market Commentary
2. Support and Resistance Levels – S&P, Nasdaq, Dow Jones, Russell 2000, Dollar Index
3. Support and Resistance Levels – Gold, Euro, Crude Oil, T-Bonds
4. Support and Resistance Levels – Corn, Wheat, Beans, Silver
5. Economic Reports for Tuesday February 12, 2013


Hello Traders,

For 2013 I would like to wish all of you discipline and patience in your trading!


Extremely low volume today in the financials markets. Chinese New Year? Maybe. Either way Happy Chinese New Year and best of luck trading to all.


Daily chart of the US Treasury Bonds ( 30 years)  for your review below. This is another good market for day-trading and in general in my opinion.


us bonds daily chart


Economic Reports and Trading Levels for February 8, 2013


Jump to a section in this post:

1. Market Commentary
2. Support and Resistance Levels – S&P, Nasdaq, Dow Jones, Russell 2000, Dollar Index
3. Support and Resistance Levels – Gold, Euro, Crude Oil, T-Bonds
4. Support and Resistance Levels – Corn, Wheat, Beans, Silver
5. Economic Reports for Friday February 8, 2013


Hello Traders,

For 2013 I would like to wish all of you discipline and patience in your trading!


More than a few clients and prospects have asked me:  How do you use the support and resistance levels? Many others have asked me about the diamond ALGO as well…There is no black and white formula but what I have in common  for both the SR levels and the Diamond ALGO is that I like to use them in conjunction with other tools/ methods etc.


In the example below, taken from today’s session, you will see two signals I got from the DIAMOND algo, one for long and one for short. At the time I got these signals, I looked at the published SR levels for today and saw that I have an opportunity to go long, using the 1494 S2 level as possible stop and about an hour later I saw an opportunity to go short using the 1505.25 pivot level as possible stop. As one can see, the long turned out nicely, the short would have probably got stopped out unless one would have taken very quick profit. I actually like to place the stops a couple of ticks BELOW or ABOVE the levels.


These are just examples and hindsight is always much easier. I decided to share this as an example because I actually used both the indicators and the published support and resistance levels to assist a full service client in taking a long trade on the mini SP 500 at that time.
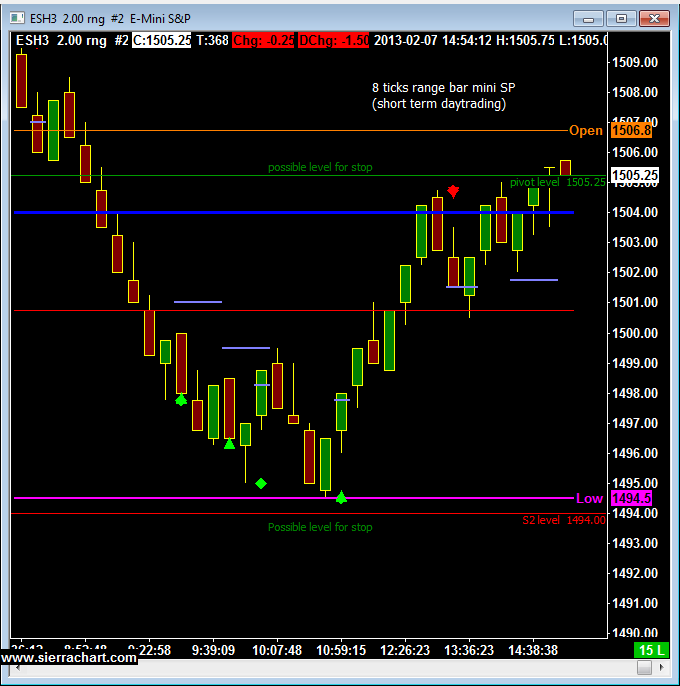
 

Mini S&P Chart

HYPOTHETICAL PERFORMANCE RESULTS HAVE MANY INHERENT LIMITATIONS, SOME OF WHICH ARE DESCRIBED BELOW.  NO REPRESENTATION IS BEING MADE THAT ANY ACCOUNT WILL OR IS LIKELY TO ACHIEVE PROFITS OR LOSSES SIMILAR TO THOSE SHOWN.  IN FACT, THERE ARE FREQUENTLY SHARP DIFFERENCES BETWEEN HYPOTHETICAL PERFORMANCE RESULTS AND THE ACTUAL RESULTS SUBSEQUENTLY ACHIEVED BY ANY PARTICULAR TRADING PROGRAM.


ONE OF THE LIMITATIONS OF HYPOTHETICAL PERFORMANCE RESULTS IS THAT THEY ARE GENERALLY PREPARED WITH THE BENEFIT OF HINDSIGHT.  IN ADDITION, HYPOTHETICAL TRADING DOES NO INVOLVE FINANCIAL RISK, AND NO HYPOTHETICAL TRADING RECORD CAN COMPLETELY ACCOUNT FOR THE IMPACT OF FINANCIAL RISK IN ACTUAL TRADING.  FOR EXAMPLE, THE ABILITY TO WITHSTAND LOSSES OR TO ADHERE TO A PARTICULAR TRADING PROGRAM IN SPITE OF TRADING LOSSES ARE MATERIAL POINTS WHICH CAN ALSO ADVERSELY AFFECT ACTUAL TRADING RESULTS.  THERE ARE NUMEROUS OTHER FACTORS RELATED TO THE MARKETS IN GENERAL OR TO THE IMPLEMENTATION OF ANY SPECIFIC TRADING PROGRAM WHICH CANNOT BE FULLY ACCOUNTED FOR IN THE PREPARATION OF HYPOTHETICAL PERFORMANCE RESULTS AND ALL OF WHICH CAN ADVERSELY AFFECT ACTUAL TRADING RESULTS.


Economic Reports and Trading Levels for February 7, 2013


Jump to a section in this post:

1. Market Commentary
2. Support and Resistance Levels – S&P, Nasdaq, Dow Jones, Russell 2000, Dollar Index
3. Support and Resistance Levels – Gold, Euro, Crude Oil, T-Bonds
4. Support and Resistance Levels – Corn, Wheat, Beans, Silver
5. Economic Reports for Thursday February 7, 2013


Hello Traders,

For 2013 I would like to wish all of you discipline and patience in your trading!


Busy morning tomorrow with some numbers out of Euro Zone and weekly unemployment here. All this will take place before the cash open ( see calendar below)


At the moment, stock index futures are a bit confusing to me….I am not getting any reading if we are about to make another leg up or if we are topping out….when that happens, one needs to wait on the sidelines.


The above refers to my “swing trading”, medium trading outlook. As far as day trading, each day has a different personality. Some days are within a range, two sided action, some days are more trend days and some days are just pure volatile. Not easy to asses what day you may have ahead when you start trading but keeping a trading journal can help you with that and much more.

In my journal I write what reports we had, market action to reports, market behavior. I also write down what mistakes I made and feelings/ emotions and much more. I promise you that keeping a trading journal will only help your trading. More on that topic in next few blogs.


Economic Reports and Trading Levels for February 6, 2013


Jump to a section in this post:

1. Market Commentary
2. Support and Resistance Levels – S&P, Nasdaq, Dow Jones, Russell 2000, Dollar Index
3. Support and Resistance Levels – Gold, Euro, Crude Oil, T-Bonds
4. Support and Resistance Levels – Corn, Wheat, Beans, Silver
5. Economic Reports for Wednesday February 6, 2013


Hello Traders,

For 2013 I would like to wish all of you discipline and patience in your trading!

Most Common Pitfalls To Avoid When Trading Commodity Futures

separator 620

500 experienced futures brokers were asked what caused most futures traders to lose money.

Their answers reflected the trading experience of more than 10,000 futures traders.  Download the PDF and find out what they said.

1.) Have a Plan

Many futures traders trade without a plan. They do not define specific risk and profit objectives before trading. Even if they establish a plan, they “second guess” it and don’t stick to it, particularly if the trade is a loss. Consequently, they overtrade and use their equity to the limit (are undercapitalized), which puts them in a squeeze and forces them to liquidate positions. Usually, they liquidate the good trades and keep the bad ones.

separator 620

2.) News Factor

Many traders don’t realize the news they hear and read has, in many cases, already been discounted by the market.

separator 620

3.) Trade Objectively

After several profitable trades, many speculators become wild and non conservative. They base their trades on hunches and long shots, rather than sound fundamental and technical reasoning, or put their money into one deal that “can’t fail.”

separator 620

4.) Know Your Size

Traders often try to carry too big a position with too little capital and trade too frequently for the size of the account.

separator 620

5.) Don’t Get Greedy

Some traders try to “beat the market” by day trading, nervous scalping, and getting greedy.


 CONTINUE READING…..


Economic Reports and Trading Levels for February 5,2013


Jump to a section in this post:

1. Market Commentary
2. Support and Resistance Levels – S&P, Nasdaq, Dow Jones, Russell 2000, Dollar Index
3. Support and Resistance Levels – Gold, Euro, Crude Oil, T-Bonds
4. Support and Resistance Levels – Corn, Wheat, Beans, Silver
5. Economic Reports for Tuesday February 5, 2013


Hello Traders,

For 2013 I would like to wish all of you discipline and patience in your trading!

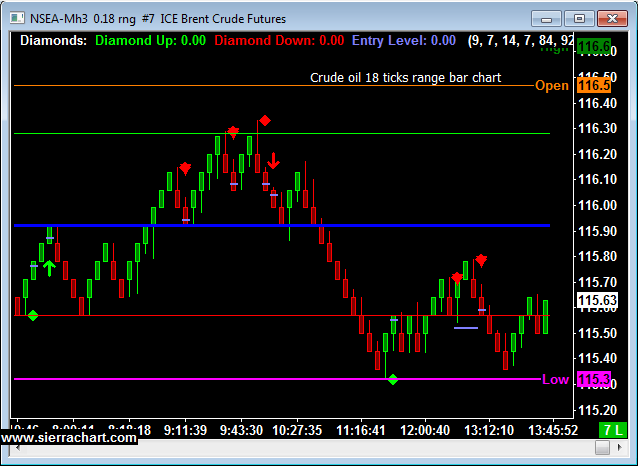
I have heard from clients about the North Sea Crude oil contract. Moves in very high correlation with the regular NYMEX crude but seems to have better volume during our night session/ pre market when most European traders will trade this contract. Thought I would share this with you as general FYI.


Below is my daytrading chart template for this contract.

Range Chart, Ice Brent Crude Futures


Would you like to have access to my DIAMOND and TOPAZ ALGOs as shown above and be able to apply for any market and any time frame on your own PC ?   You can now have a two weeks free trial where I enable the ALGO along with few studies for your own sierra/ ATcharts.


To start your trial, please visit:


If so, please send me an email with the following information:


1. Are you currently trading futures?

2. Charting software you use?

3. If you use sierra or ATcharts, please let me know the user name so I can enable you

4. Markets you currently trading?


Economic Reports and Trading Levels for February 1, 2013


Jump to a section in this post:

1. Market Commentary
2. Support and Resistance Levels – S&P, Nasdaq, Dow Jones, Russell 2000, Dollar Index
3. Support and Resistance Levels – Gold, Euro, Crude Oil, T-Bonds
4. Support and Resistance Levels – Corn, Wheat, Beans, Silver
5. Economic Reports for Friday February 1, 2013


Hello Traders,

For 2013 I would like to wish all of you discipline and patience in your trading!

NFP (Non Farm Payroll) also known as monthly unemployment figures tomorrow morning 8:30 AM Eastern time. This is another market moving report and even though the last one was a non event, traders need to be ready in case volatility picks up.

Remember, NO TRADE IS BETTER THAN  A BAD TRADE


Continue reading “Economic Reports and Trading Levels for February 1, 2013”

Economic Reports and Trading Levels for January 31, 2013


Jump to a section in this post:

1. Market Commentary
2. Support and Resistance Levels – S&P, Nasdaq, Dow Jones, Russell 2000, Dollar Index
3. Support and Resistance Levels – Gold, Euro, Crude Oil, T-Bonds
4. Support and Resistance Levels – Corn, Wheat, Beans, Silver
5. Economic Reports for Thursday January 31, 2013


Hello Traders,

For 2013 I would like to wish all of you discipline and patience in your trading!

 Pit traded SP 500 daily chart for your review below. In order for the market to have a chance at visiting the 1465 level, we need to see some follow through selling tomorrow. As long as market does NOT close above 1506, I I would look to attack it from the short side.

sp500


Trading Levels and Reports for January 30, 2013


Jump to a section in this post:

1. Market Commentary
2. Support and Resistance Levels – S&P, Nasdaq, Dow Jones, Russell 2000, Dollar Index
3. Support and Resistance Levels – Gold, Euro, Crude Oil, T-Bonds
4. Support and Resistance Levels – Corn, Wheat, Beans, Silver
5. Economic Reports for Wednesday January 30, 2013


Hello Traders,

For 2013 I would like to wish all of you discipline and patience in your trading!


The FOMC interest rate decision is due at 2:15 PM ET in the US tomorrow ( Wednesday, Jan. 30th ). Also more than a few economic numbers ahead of the announcement.


FOMC days have different characteristics than other trading days. If you have traded for a while, check your trading notes from past FOMC days that may help you prepare for tomorrow.


if you are a newcomer, take a more conservative approach and make sure you understand that the news can really move the market.

On a personal levels, I usually STOP trading an hour before FOMC announcement and either stop for the day or resume 15 minutes after.


The following are suggestions on trading during FOMC days:


  • Reduce trading size
  • Be extra picky = no trade is better than a bad trade
  • Choose entry points wisely. Look at longer time frame support and resistance for entry. Take the approach of entering at points where you normally would have placed protective stops. Example, trader x looking to go long the mini SP at 1425.00 with a stop at 1419.00, instead “stretch the price bands” due to volatility and place an entry order to buy at 1419.75 and place a stop a few points below in this hypothetical example.
  • Expect the higher volatility during and right after the announcement
  • Expect to see some “vacuum” ( low volume, big zigzags) right before the number.
  • Consider using automated stops and limits attached to your entry order as the market can move very fast at times.
  • Know what the market was expecting, learn what came out and observe market reaction for clues
  • Be patient and be disciplined