Order Flow, Buy & Sell Zones, & Support and Resistance Levels 9.24.2021

Dear Traders,

Get Real Time updates and more on our private FB group!
Separator

Yesterday we hosted a very interesting webinar with Bookmap about order flow, buy and sell zones, liquidity of large orders and MUCH MORE.

On a personal level I really enjoyed the information as I am the type of guy who has been looking at indicators/ volume charts, range bar charts and probably many of the things that many of futures traders are used to. The data and information shared yesterday during live market hours with forward thinking analysis was very interesting to me and I will do more homework on the topic.

If you did not attend the webinar and would like to see a recording, CLICK HERE.

Good Trading

Trading Futures, Options on Futures, and retail off-exchange foreign currency transactions involves substantial risk of loss and is not suitable for all investors.  You should carefully consider whether trading is suitable for you in light of your circumstances, knowledge, and financial resources. You may lose all or more of your initial investment. Opinions, market data, and recommendations are subject to change at any time when it comes to Futures Trading.


Futures Trading Levels

9-24-2021
e31b0360 5d01 44b0 a703 8e8d03c54ccb

Economic Reports, source: 

 www.BetterTrader.co

dc0eca88 6936 4ecf 8aaf edac3d3e25d6

This is not a solicitation of any order to buy or sell, but a current market view provided by Cannon Trading Inc. Any statement of facts here in contained are derived from sources believed to be reliable, but are not guaranteed as to accuracy, nor they purport to be complete. No responsibility is assumed with respect to any such statement or with respect to any expression of opinion herein contained. Readers are urged to exercise their own judgement in trading as well as options on futures.

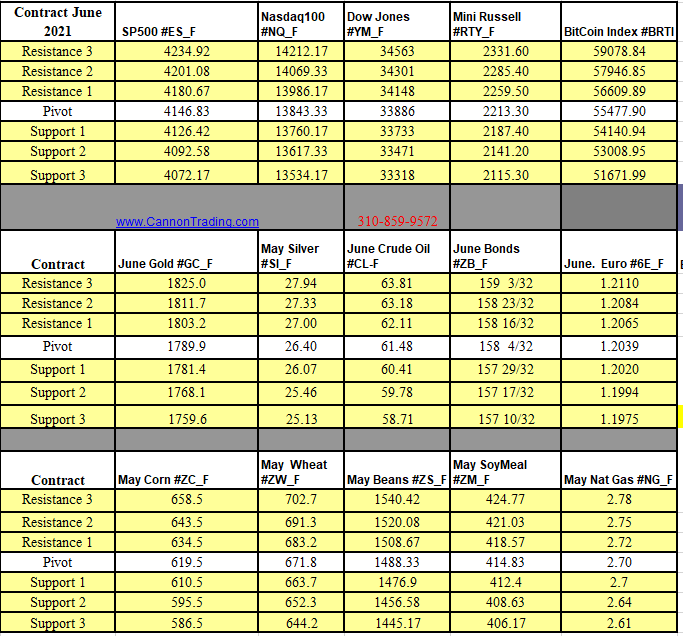
Futures Trading Levels for April 22nd, 2021

_________________________________________________

Voted #1 Blog and #1 Brokerage Services on TraderPlanet for 2016!!  

_________________________________________________

Like us on FaceBook!
Get Real Time updates and market alerts on Twitter!
Get Real Time updates and more on our private FB group!
Dear Traders,
Today’s action in Silver, gold, SP and NQ lead me to write the quick piece below.
Few words on BREAKOUT trading.
The concept is one of many different traders use.
Some like to use COUNTRER TREND trading.
others look at ORDER FLOW, some will use support and resistance mainly and hopefully more traders will master a few different techniques and use the appropriate one depending on the type of trading day that is developing in front of their eyes.
The concept of break out trading looks for the market to “snap out” of a certain trading range and continue moving in that direction. The toughest part is to filter out the “fake breakouts” and recognize early enough which breakouts have the potential to be a powerful one.
A few tips to explore:
Look for a breakout on a smaller time frame that will coincide with a longer time frame CURRENT trend. So you may look at a daily trend and look for a breakout on the hourly chart?
You may trade smaller time frames and look for breakouts that will coincide with the 30 minute chart time frame.
Last but not least ( for today only of course as I am sure there are MUCH more than the short few pointers I am sharing….) try utilizing different type of charts and do your homework in regards to which breakouts seem to work better than others. Look at RANGE BAR charts, explore VOLUME charts, maybe even take a look at Renko bars and other types as well.
30 MINUTES chart of ES below with 4 different pointers to look at, marked A through D. CLICK for larger IMAGE. ALWAYS much easier to look back in hindsight and explain what happened….I wish it was that easier when trading live….Click on the chart so you are able to read the pointers along with some insight for educational purposes.
210421EP E Mini S%26P 500 Equalized Active 30 Min Continuation
To access a free trial to the ALGOS shown in the chart along with other tools? (Slanted arrows possible buy, diamonds = possible exit/ tighten stops) visit and sign up for a free trial for 21 days with real-time data.

Good Trading

Trading Futures, Options on Futures, and retail off-exchange foreign currency transactions involves substantial risk of loss and is not suitable for all investors.  You should carefully consider whether trading is suitable for you in light of your circumstances, knowledge, and financial resources. You may lose all or more of your initial investment. Opinions, market data, and recommendations are subject to change at any time when it comes to Futures Trading.


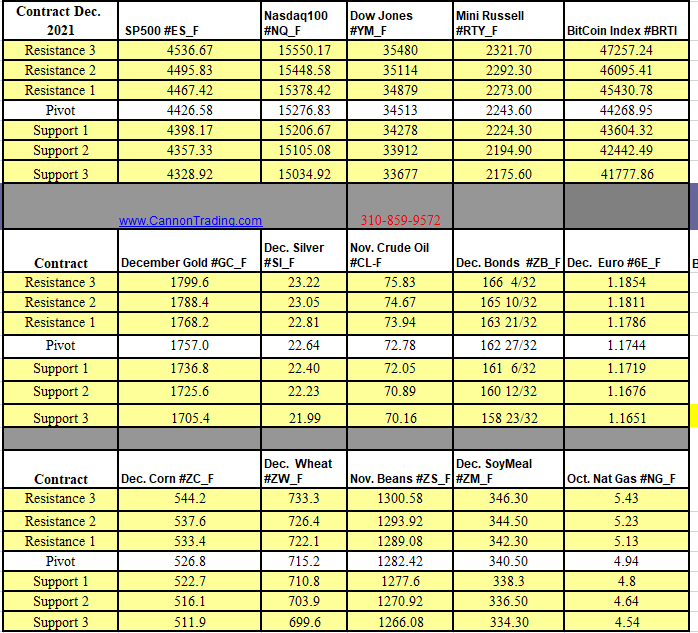
Futures Trading Levels

4-22-2021

cd7ef5a3 24a0 44cb aec6 76ba3670a6a1

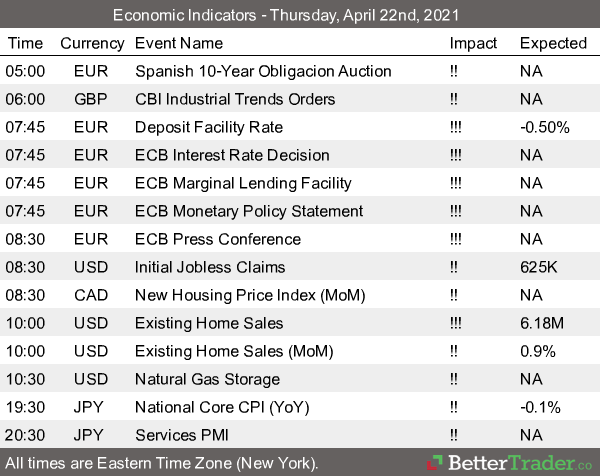
Economic Reports, source: 

 www.BetterTrader.co


cac45270 488d 4ad4 a941 0f4f55cfe297

This is not a solicitation of any order to buy or sell, but a current market view provided by Cannon Trading Inc. Any statement of facts here in contained are derived from sources believed to be reliable, but are not guaranteed as to accuracy, nor they purport to be complete. No responsibility is assumed with respect to any such statement or with respect to any expression of opinion herein contained. Readers are urged to exercise their own judgement in trading.

Gold Outlook + Trading Levels 5.17.2018

____________________________________________________________________

Voted #1 Blog and #1 Brokerage Services on TraderPlanet for 2016!!  

____________________________________________________________________

Dear Traders,
Gold: At the Crossroads of Fiscal and Monetary Policies
Twice this year implied volatility in gold options spiked from 9% to around 13.5%. Proportionally, that represents a 50% rise and seems like a big move, at least by the standards of recent history. What is more remarkable, however, is how calm the gold market has generally been. For the past two years, implied volatility on gold options have been near the lowest levels in recent memory and are a far cry from the 17% average levels that prevailed in 2015 and 2016, much less the spikes above 30% in 2011 and 2013 (Figure 1). So why has the gold market been so placid and what will likely drive volatility?

Continue reading “Gold Outlook + Trading Levels 5.17.2018”

Energy Futures Outlook 5/15/2018

____________________________________________________________________

Voted #1 Blog and #1 Brokerage Services on TraderPlanet for 2016!!  

____________________________________________________________________

Dear Traders,
Oil Market Dynamics in Play: What to Watch in Coming Weeks
By Blu Putnam, Chief Economist, CME Group
Oil: Will Mideast Risk Premium Rise Before Driving Season?
Highlights
  • U.S. shale oil production can respond faster to price changes
  • Ramp-up in U.S. production could be tempered by drilling challenges
  • U.S. oil exports have changed the dynamics of Brent-WTI price spread
 Unleaded Gasoline Daily Chart for your review below:
Unleaded Gasoline Daily Chart 

If you like to set up a time and chat with a licensed series 3 broker, pleasecontact us.

Continue reading “Energy Futures Outlook 5/15/2018”

Grain Futures Outlook 5.11.2018

____________________________________________________________________

Voted #1 Blog and #1 Brokerage Services on TraderPlanet for 2016!!  

____________________________________________________________________

Dear Traders,

If you are trading grains and grain futures, the following link will provide you with some good insight into the near future of grain prices following today’s report:

https://www.dtnpf.com/agriculture/web/ag/news/article/2018/05/10/new-crop-corn-soybean-forecasts 

 Daily chart of Soybeans futures #ZS_F below: Daily chart of Soybeans futures #ZS_F

Continue reading “Grain Futures Outlook 5.11.2018”

Trade Systems Results 5.09.2018

____________________________________________________________________

Voted #1 Blog and #1 Brokerage Services on  TraderPlanet   for 2016!!

____________________________________________________________________

Dear Traders,
The Iran nuclear agreement “event” caused quite a bit of intraday volatility in the markets, mostly in crude oil and related energies but also in equities and gold.
As a trader, you must know which reports, events are scheduled and the possible effects they may have on the markets you trade.
keeping a trade journal WILL help.
On a different note:
Browse and view ACTUAL trading results from different trading systems offered at Cannon Trading Co, Inc.
If you like to set up a time and chat/ evaluate any system with a licensed series 3 broker, please contact us.

Continue reading “Trade Systems Results 5.09.2018”

List of First Notice and Last Trading Days for May 5.08.2018

____________________________________________________________________

Voted #1 Blog and #1 Brokerage Services on  TraderPlanet   for 2016!!

____________________________________________________________________

Dear Traders,
Heads up with upcoming first notice and last trading days for various commodities below. Please contact us with any questions:
 
First Notice Day
Contract Month
Contract
1-May
May
ICE Sugar
1-May
May
Orange Juice
1-May
May
London Coffee
30-May
June
Long Gilt (Liffe)
31-May
June
2-Yr. & 5-Yr. Notes
31-May
June
10-Yr. Notes & 30-Yr. Bonds
31-May
June
COMEX & ICE Metals
Last Trading Day
Contract Month
Contract
1-May-18
April
Milk III & Butter
8-May-18
May
Cotton
10-May-18
May
Orange Juice
14-May-18
May
CME Eurodollar
14-May-18
May
Wheat (CBOT, KC, MN)
14-May-18
May
CBOT Corn & Oats
14-May-18
May
Lean Hogs
14-May-18
May
CBOT Soybeans
14-May-18
May
CBOT Soybean Meal & Oil
14-May-18
May
CBOT Rice
14-May-18
May
Canola
15-May-18
May
ICE Cocoa
15-May-18
May
Lumber
15-May-18
May
London Cocoa
18-May-18
May
ICE Coffee
22-May-18
June
NYMEX Crude Oil
24-May-18
May
Feeder Cattle
29-May-18
May
COMEX & ICE Metals
29-May-18
June
NYMEX Natural Gas
29-May-18
June
Live Cattle
30-May-18
May
Milk III & Butter
31-May-18
May
30-Day Fed Funds
31-May-18
June
NYMEX RBOB & Heating Oil
31-May-18
July
ICE Brent Crude Oil
31-May-18
May
London Coffee

Continue reading “List of First Notice and Last Trading Days for May 5.08.2018”

5 Fact about Brent Crude 5.4.018

____________________________________________________________________

Voted #1 Blog and #1 Brokerage Services on  TraderPlanet   for 2016!!

____________________________________________________________________

Dear Traders,
5 Facts about Brent Crude 
By Senior Broker, Mark O’ Brien

Brent crude is a primary classification of crude oil used as a reference price for trading crude oil around the world. It is also known as London Brent and Brent Blend.

It was first extracted in 1976 from a small area in the North Sea called the Brent field by Shell U.K. Limited (now Royal Dutch Shell), which made it a practice of naming oil fields after water birds.  For this particular area, the name comes from a small water bird called the Brent goose.

While the Brent field is now no longer economically viable, Brent crude is now comprised of oil extracted from fifteen later-developed oil fields located throughout the North Sea, an area of roughly 220,000 square miles.  This area comprises by far the largest oil reserves in western Europe – land or sea.

Read more at

http://www.stockhouse.com/opinion/independent-reports/2018/05/01/5-facts-about-brent-crude#aPaDiqdofoX4VG2J.99

Continue reading “5 Fact about Brent Crude 5.4.018”

Support & Resistance Levels 5.3.018

____________________________________________________________________

Voted #1 Blog and #1 Brokerage Services on  TraderPlanet   for 2016!!

____________________________________________________________________

Dear Traders,
There will be no market commentary today. Read full article to see trading levels and economic reports for Thursday, May 3rd 2018.

Continue reading “Support & Resistance Levels 5.3.018”

The Difference Between Commodities And Equities Trading 5.2.018

____________________________________________________________________

Voted #1 Blog and #1 Brokerage Services on  TraderPlanet   for 2016!!

____________________________________________________________________

Dear Traders,

The Difference Between Commodities And Equities Trading

A Commodity: What is a legal contractual agreement to make or take delivery of a particular product?
An Equity or Common Stock: What is a legal contractual ownership in a company?
Similarities.
  • Both have regulated markets
  • Both can utilize the same/identical indicators, charting conventions to identify, trends and trade set-ups.
  • Order mechanics: Market, Stops, Stop limits, OCO’s, OSO’s GTC’s
  • Fees: Less than $7.00 per order/contract

Continue reading “The Difference Between Commodities And Equities Trading 5.2.018”