High Volatility This Week and 8 Steps to Successful Futures Trading | Support and Resistance Levels

In this post:

1. Market Commentary
2. Support and Resistance Levels
3. Daily Mini S&P 500 Futures Chart
4. Download “8 Steps to Successful Futures Trading”
5. Economic Reports
6. Earnings Releases

divider black 190

1. Market Commentary

Wow, what a day in the metals segment and what a week in general. Fits perfectly what I wrote the last few days:

ALWAYS EXPECT THE UNEXPECTED! When volatility skyrockets like now, moves become extreme, the speed of the market really picks up and this is when one must adjust their trading size lower to accommodate for the wilder and wider moves.

My 15 min mini SP chart below for your review ,clients who attend my daily live charts program had access to this chart in real-time, along with the signals generated. Continue reading “High Volatility This Week and 8 Steps to Successful Futures Trading | Support and Resistance Levels”

Futures Trading Levels, It Is a Bear Market

Per my comments yesterday, we did see the market take the next leg after consolidating for a few days and it was a down leg….and again volume was significantly higher than we had during the bounce.

The trend is obviously down, but bear markets can also have powerful rallies, intraday and on daily chart basis. Separate the daily chart from your minute to minute trading action. Know what time frame you are trading and know your trading goals. If you are a swing trader then look at the daily chart AND hourly chart but don’t let the shorter time frame picture distort your longer term view. On the flip side, if you are a day trader who is using primarily 1 min chart or tick charts etc., understand what the daily and hourly picture looks like but make your trading decisions based on the time frame you are working with.

Daily chart for your review with some FIB extensions on the way down. 1206.75 is now the first MAJOR resistance, 1103 is the first defense before we visit the 1077 lows made August 9th

Daily Futures chart of the Mini S&P 500 from August 18th, 2011

Daily Futures chart of the Mini S&P 500 from August 18th, 2011

Trading Futures, Options on Futures, and retail off-exchange foreign currency transactions involves substantial risk of loss and is not suitable for all investors. You should carefully consider whether trading is suitable for you in light of your circumstances, knowledge, and financial resources. You may lose all or more of your initial investment. Opinions, market data, and recommendations are subject to change at any time. Continue reading “Futures Trading Levels, It Is a Bear Market”

Futures Trading Levels, Next Leg: Up or Down?

Stock indices are consolidating for the last 3 sessions, trading between 1176 and 1207 on the mini SP 500.

The fact that the consolidation is taking place after a big move down and on lesser volume suggests to me that we are about to see another big move. My guess is that if we break below 1180 on the way down, the next big leg is lower and if we break above 1212 then the next big leg will be towards the 1280 region. Only time will tell if my speculation is correct. In the mean time, know the time frame you are trading, the risk you are willing to take, calculate probabilities and risk / reward and then once you have planned your trade, trade your plan. And yes, I know, it is much easier said than done…..

Daily Mini SP500 chart for your review below with the levels I mentioned above

Daily Futures chart of the Mini S&P 500 from August 17th, 2011

Daily Futures chart of the Mini S&P 500 from August 17th, 2011

Trading Futures, Options on Futures, and retail off-exchange foreign currency transactions involves substantial risk of loss and is not suitable for all investors. You should carefully consider whether trading is suitable for you in light of your circumstances, knowledge, and financial resources. You may lose all or more of your initial investment. Opinions, market data, and recommendations are subject to change at any time. Continue reading “Futures Trading Levels, Next Leg: Up or Down?”

Futures Trading Levels, High Volatility and High Volume

May be a record volume day, if not pretty close to it. We traded over 6 million contracts of the emini SP 500. We did over 5 Mil yesterday. Market has sold off quite a bit over the last few days. While my medium to longer term view is still bearish, short term I think we might be due for a bounce.

Daily Chart of the Mini S&P 500 from August 5th, 2011

Daily Chart of the Mini S&P 500 from August 5th, 2011

When markets trade with such high volatility, one must understand the enviroment he or she are trading in, which is quite different from the enviroment of few weeks ago.

Ranges are wider, speed is faster and volume is higher. You must take that into account, adjust your trading accordingly and make sure that you set limits as far as your daily risk is concerned and not allow for one trade or one trading day to wipe your trading account.

I wrote more about the topic in an article called: “Survivor day-trading“.

Have a great weekend!! Continue reading “Futures Trading Levels, High Volatility and High Volume”

Futures Trading Levels, Times of High Volatility

When markets trade with such high volatility, one must understand the enviroment he or she are trading in, which is quite different from the enviroment of few weeks ago.

Ranges are wider, speed is faster and volume is higher. You must take that into account, adjust your trading accordingly and make sure that you set limits as far as your daily risk is concerned and now allow for one trade or one trading day wipe your trading account.

I wrote more about the topic in an article called: “Survivor day-trading

In between, weekly chart of mini Russell with long term FIB levels for your review.

BIG NUMBERS TOMORROW BEFORE THE OPEN CAN EVEN ADD TO THE VOLATILITY.

Monthly Chart of the Mini Russell from August 4th, 2011

Monthly Chart of the Mini Russell from August 4th, 2011 Continue reading “Futures Trading Levels, Times of High Volatility”

Futures Trading Levels, Proceed With Caution

When markets trade with such high volatility, one must understand the enviroment he or she are trading in, which is quite different from the enviroment of a few weeks ago.

Ranges are wider, speed is faster and volume is higher. You must take that into account, adjust your trading accordingly and make sure that you set limits as far as your daily risk is concerned and not allow for one trade or one trading day to wipe your trading account.

I wrote more about the topic in an article called: “Survivor day-trading.”

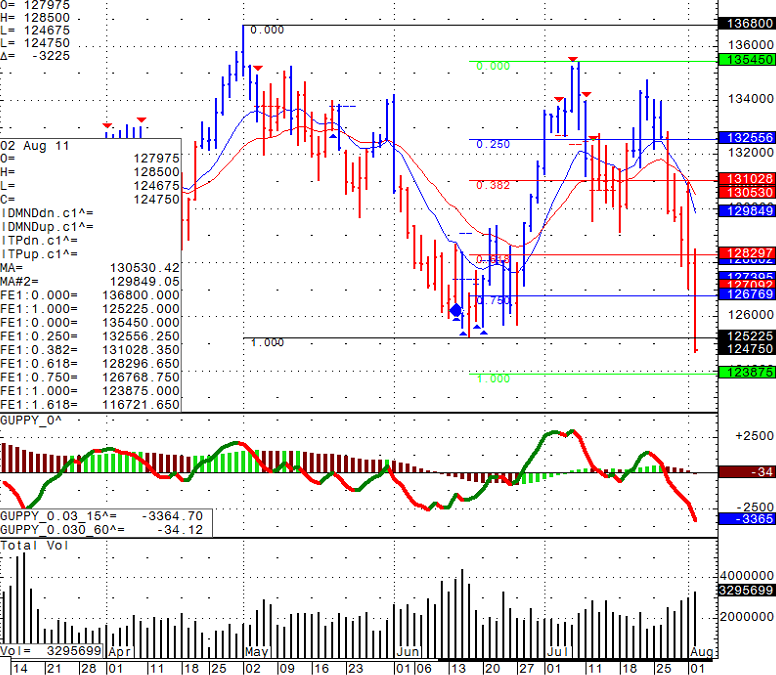
In between, daily chart of Mini SP for your review below. I ran some FIB extensions and the next target if this sell off continues is 1238.75:

Daily Chart of the Mini S&P 500 from August 2nd, 2011

Daily Chart of the Mini S&P 500 from August 2nd, 2011 Continue reading “Futures Trading Levels, Proceed With Caution”

Futures Trading Levels, Diamond Algorithm and Daily Webinar

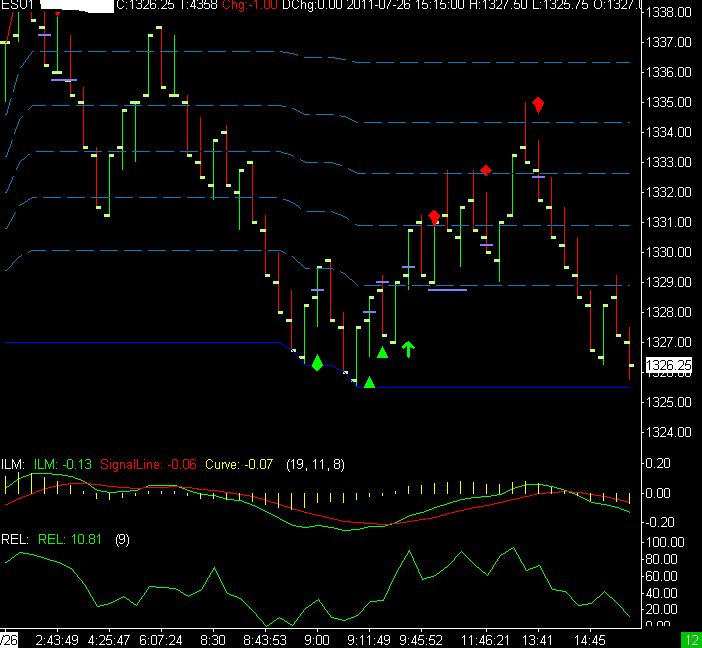
For your review, you can see my intra-day chart for the mini SP from today’s session.

You can view this chart and other charts by registering to the daily , live charts service trial at:

Day Trading Webinar

Intra-Day Chart of the Mini SP from July 26th 2011

Intra-Day Chart of the Mini SP from July 26th 2011

Would you like to have access to my DIAMOND ALGO as shown above?

Come and view it in real time by visiting:

Trading Algorithm Continue reading “Futures Trading Levels, Diamond Algorithm and Daily Webinar”

Futures Trading Levels, Trading During the Debt Battle

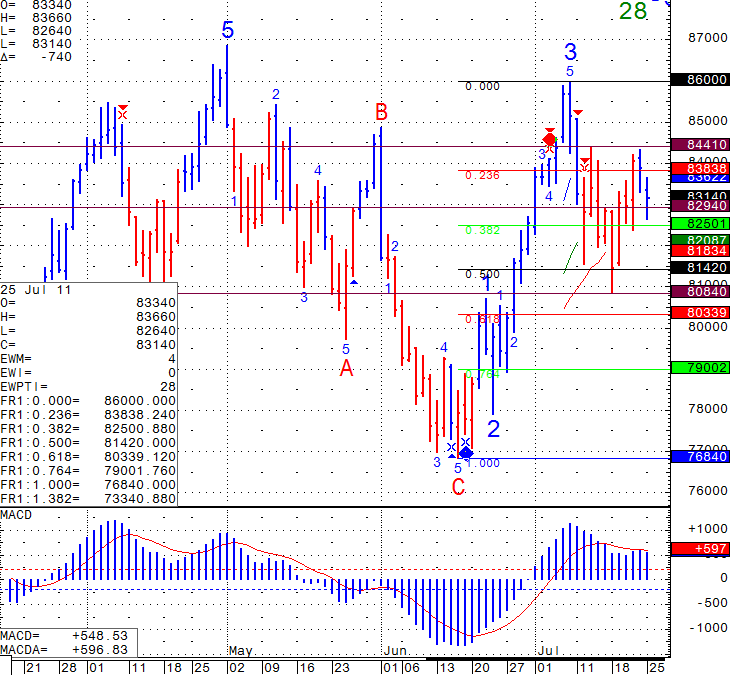
With the US Debt battle taking place, I will speculate that we can see wide trading ranges but should remain between the 808.40 ( July 18th low) to 843.90 ( July 13th high) basis the Sept. Mini Russell 2000. Definitely a wide range and possibility of volatility picking up.

Know the risk you are comfortable with each time you enter a trade.

Daily Chart of the Mini Russell from July 25th 2011

Daily Chart of the Mini Russell from July 25th 2011

Would you like to have access to my DIAMOND ALGO as shown above and be able to apply for any market and any time frame? The screen shot above is of the Mini Dow from today.

If so, please send me an email with the following information:

  1. Are you currently trading futures?
  2. Charting software you use?
  3. If you use sierra or ATcharts, please let me know the user name so I can enable you.
  4. Markets you currently trading? Continue reading “Futures Trading Levels, Trading During the Debt Battle”

Futures Trading Levels, Possible Scenarios After Debt Ceiling Deadline

We have been asked by clients and prospects:

— “How will a US default on its debt affect futures markets?”

So I turned to my colleague, Jonathan Day who has been a senior broker with Cannon Trading since 2003 and is an ex floor broker/ trader for his insights:

The 1 billion (or I guess in this day and age the trillion dollar) question is, what happens if by August 2nd a deal has or has not been agreed on and the ramifications to commodities and futures markets? Based on the past performance of the US government it is likely that in the waning moments, our divided leaders will agree to some sort of deal. If a deal is not reached, does the sun rise the next day?

Let’s start with a deal not being reached and debt ceiling is not raised. There is no way around the fact that the rating agencies will have to down grade US debt. This, in turn, will trigger sell offs in equities, US treasury futures and most commodities. With yields on the rise, a surprising winner in the short term could be Gold and possibly silver, as traders will be looking for a short term haven for cash getting pulled from every other asset class. After the initial shock of the August 2nd deadline deal not being struck, look for the Fed balance sheet to expand tremendously over the next several days to provide cushion for the market. I would look for a rise in yields to continue in US treasuries until a deal is done. Then it could materialize into buying situation for treasury futures as the higher yields will put pressure on equities and Bernanke to take action to try and cap rates. He has already hinted loudly that more quantitative easing is on the table.

Another interesting outcome of a technical default would be the opportunity and first step to create meaningful fiscal policy to getting the US government’s finances in order. These reductions would help strengthen the dollar and fiscal outlook which in turn would help create good standing with our creditors. Benefactors would be the dollar and bonds and the losers would be equities and precious metals.

I am not very optimistic about that outcome as it would take nerves of steel by our leaders. The probable outcome will be last minute deal that kicks the proverbial “can” down the road and accomplishes little in the way of meaningful deficit reduction. This leaves us more or less in the same position we are in right now. In short commodities, bonds, and equities will benefit with a knee jerk reaction and precious metals will take a hit. Once the euphoria of the crisis averted has worn off we would slide right back into the same trap until we need the debt ceiling raised again.

If the deficit reduction is going to be more than 4 ½ trillion, I expect a large rise in the in the bond market. In turn, there will be a large decline in precious metals.

If you are China and hold a tremendous amount of US paper which you can not move with any speed or size for obvious reasons. Would you prefer to wait a week for some coupon payments while US creates meaningful deficit reduction measures? Or take your payments on time with a wet noodle deal that will only weaken the value of your investment over time.

Look for choppy markets over the next 10 trading days and remember Washington has the track record of always “kicking the can down the road” so trade accordingly and good luck.

** The material contained in this letter is of opinion only and does not guarantee any profits. These are risky markets and only risk capital should be used. Past performances are not necessarily indicative of future results.

*** This is not a solicitation of any order to buy or sell, but a current market view provided by Cannon Trading Inc. Any statement of facts herein contained are derived from sources believed to be reliable, but are not guaranteed as to accuracy, nor they purport to be complete. No responsibility is assumed with respect to any such statement or with respect to any expression of opinion herein contained. Readers are urged to exercise their own judgment in trading!

Continue reading “Futures Trading Levels, Possible Scenarios After Debt Ceiling Deadline”