Futures Trading Levels, Non-Farm Employment Report

Cannon Trading / E-Futures.com

Market will be waiting monthly un employment numbers , tomorrow morning before the open of cash market.

Its a wild ride so hang on with everything you got.

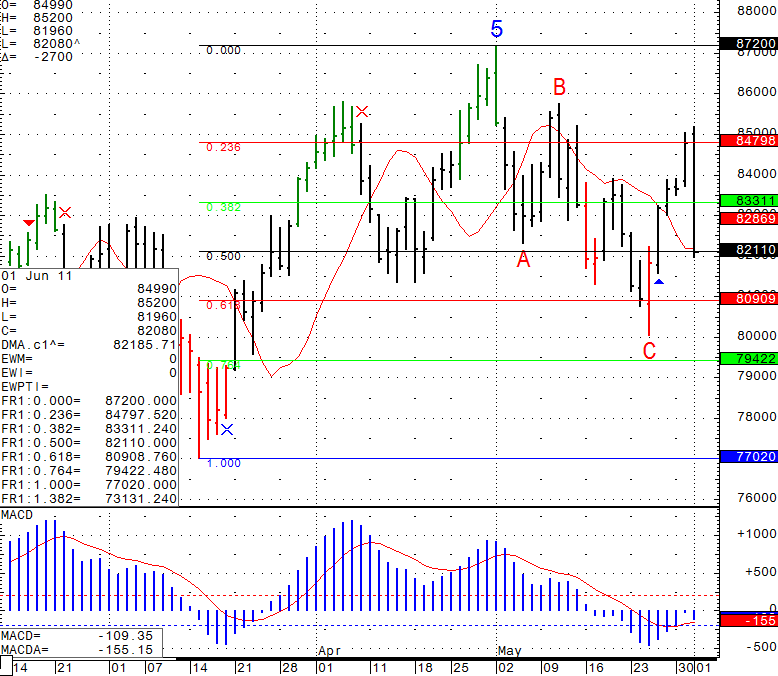
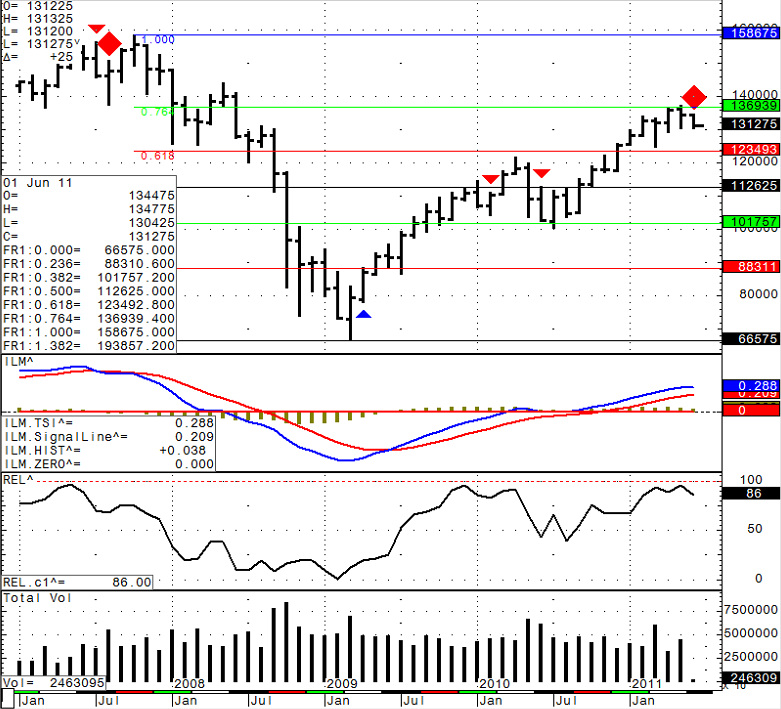
Since we started a new month, I figured I will share a monthly chart for your review.

From MY TECHNICAL perspective, if we can break below, we may see a deeper correction.

Monthly mini S&P trading chart screenshot from today June 2nd, 2011

Stock futures trading chart levels for Thursday June 2st, 2011 Continue reading “Futures Trading Levels, Non-Farm Employment Report”

Futures Trading Levels, Possible S&P Mini June Volatility

Cannon Trading / E-Futures.com

June started out with a strong sell off, higher volatility and higher volume than we have seen in a while….if the first day is any sign, then we are in for a volatile month!

Below is a daily chart of Mini Russell 2000 for your review.

Daily Mini Russell 2000 trading chart screenshot from today June 1st, 2011

Stock futures trading chart levels for Wednesday June 1st, 2011

Also a good article I wrote a few years back entitled “Survival Day Trading” is available at the Cannon Trading Futures Trading Newsletter. Continue reading “Futures Trading Levels, Possible S&P Mini June Volatility”

Futures Trading Levels, Change of Month and Change of Contracts

Cannon Trading / E-Futures.com

Wishing everyone a great trading month in June!

Please keep in mind that we are now trading SEPTEMBER BONDS, SEPT. TEN YEARS and other financials.

Also we are now trading AUGUST GOLD.

We will be rolling currencies and indices next Thursday, June the 9th. if you have any questions, please contact your broker. Continue reading “Futures Trading Levels, Change of Month and Change of Contracts”

Futures Trading Levels, Slow Buying Equates to Downward Pressure

Cannon Trading / E-Futures.com

Interesting price action in stock index futures today. We made a recent low overnight, bounced nicely through out the session but then sold off during the last 20 minutes or so. For me that is a sign that there is not enough fresh buying still and pressure is still favoring the downside with 1292 as the next target. HOWEVER, if buyers can push above 1327 it will change the picture and require a re-evaluation of the market.

Daily mini SP 500 chart for your review below: Continue reading “Futures Trading Levels, Slow Buying Equates to Downward Pressure”

Futures Trading Levels, Market Consolidation and Crude Oil Inventories

Cannon Trading / E-Futures.com

Yesterday I wrote:

“If we break todays low of 1310.75, I will favor a move down to 1290. On the other hand if we can hold this level, we may see a bounce to 1326”.

Well…..we had an inside day trading within the range of the previous day, that means market took a bit to consolidate before deciding on the next leg. The Million $$ question is which way…..so far we have been making lower lows and lower highs over the past couple of weeks

Daily chart of Mini SP 500 along with some levels to be aware of, for your review below: Continue reading “Futures Trading Levels, Market Consolidation and Crude Oil Inventories”

Futures Trading Levels, Economic Reports Resume Today

Cannon Trading / E-Futures.com

Daily chart of mini SP 500 below.

If we break todays low of 1310.75, I will favor a move down to 1290. On the other hand if we can hold this level, we may see a bounce to 1326. Chart for your review below: Continue reading “Futures Trading Levels, Economic Reports Resume Today”

Futures Trading Levels, Our Daily Web Service Webinar as an Educational Tool

Cannon Trading / E-Futures.com

As I mentioned before, I hold a daily service where I share my intraday charts in real time with my indicators, set ups and much more.

If you are interested to see what it looks like, you can now scroll or watch the entire 30 minutes video below from a trading session of Thursday May 19th. I hope it provides a better example of what the service is and if interested, you can sign up for a free trial.

Free trial of the Live Web Trading Webinar.

Click here to watch the 30 minute video.

Have a great weekend!! Continue reading “Futures Trading Levels, Our Daily Web Service Webinar as an Educational Tool”

Futures Trading Levels, Watch For Expiring Indices Tomorrow

Cannon Trading / E-Futures.com

Buy signal from yesterday morning reached first target of 1341.70 and we closed right around this level.

Will be interesting to see if we will continue to 1353 or is this the extent of the bounce…time will tell! Continue reading “Futures Trading Levels, Watch For Expiring Indices Tomorrow”

Futures Trading Levels, Get Access to Charts and Analysis of Every Major World Market

Cannon Trading / E-Futures.com

100+ Page Report – Charts & Analysis of Every Major World Market

How to be a successful futures trader

Over the past month we have witnessed extreme volatility in the metals, crude oil, currencies and global stock markets. Will this volatility continue or is it time for “sell in May and go away”? No matter what happens, it will affect your portfolio and your finances.

Analysis of these questions can be found in the current issue of Global Market Perspective, a 100+ page book full of investment analysis and forecasts for every major world market. For the remainder of May you can download this important resource FREE!

Global Market Perspective includes Elliott Wave International’s analysis of stock and interest rate markets in three regions, U.S., Europe and Asia, plus analysis from EWI’s market specialists who cover gold & silver, crude oil and currencies.

You’ll learn:

  • The outlook for crude oil prices.
  • Which world stock markets are ready to continue their rally.
  • If metals will continue their dramatic fall.
  • The outlook for the dollar – has it finally bottomed?
  • About investment manias that are occurring right before your eyes.

We invite you to benefit from the current issue – a $49 value – with no obligation.

Elliott Wave International: Ezpert Market Forecasting. Continue reading “Futures Trading Levels, Get Access to Charts and Analysis of Every Major World Market”

Futures Trading Levels, Example of Successful Signal

Cannon Trading / E-Futures.com

Below is a screen shot from todays daily live chart service along with some of the signals traders had access to:

Daily mini S&P trading chart screenshot from today May 16th 2011

Stock futures trading chart levels for Tuesday May 17th 2011

Obviously the screen shot above is of the more successful signals we got and not all signals are that successful but it gives you an idea of what you can look for when you visit…

Free Trial: Webinar.

Trading has large potential rewards, but also large potential risk. You must be aware of the risks and be willing to accept them in order to invest in the markets. The past performance of any trading system or methodology is not necessarily indicative of future results.

Rule 4.41 – Hypothetical or simulated performance results have certain limitations. Unlike an actual performance record, simulated results do not represent actual trading. Also, since the trades have not been executed, the results may have under-or-over compensated for the impact, if any, of certain market factors, such as lack of liquidity. Simulated trading programs in general are also subject to the fact that they are designed with the benefit of hindsight. No representation is being made that any account will or is likely to achieve profit or losses similar to those shown. Continue reading “Futures Trading Levels, Example of Successful Signal”