Thursday Morning Support and Resistance

Here’s a morning cup o’ joe for all you futures traders, our morning support and resistance levels. Good trading!

divider black 190

Support and Resistance Levels – S&P 500, Nasdaq 100, Dow Jones, Mini Russell 2000, 30-Year US Bond, 10-Year US Note

Contract (Mar. 2012) Mini S&P 500 Mini Nasdaq 100 Dow Jones Mini Russell 2000 30-Year US Bond 10-Year US Note
Resistance Level 3—————————————— Resistance Level 2——————————————

Resistance Level 1

——————————————

Support Level 1

——————————————

Support Level 2

——————————————

Support Level 3

13541348.75


1343.25


1348.75


1343


1337.75

26002578


2565


2543


2535


2515

1293112842


12788


12757


12703


12649

832.00822.2


816.1


810.3


806.5


792.20

1440614327


14321


14221


14209


14129

1312613124.5


13118.5


13110


13105.5


13100

Continue reading “Thursday Morning Support and Resistance”

New Video | Support and Resistance Levels

Jump to a section in this post:
1. Market Commentary
2. Support and Resistance Levels – S&P, Nasdaq, Dow Jones, Russell 2000
3. Support and Resistance Levels – Gold, Euro, Crude Oil, T-Bonds
4. Support and Resistance Levels – March Corn, March Wheat, Jan Beans, March Silver
5.Economic Report for February 15, 2012

1. Market Commentary

Hello Traders,

About 6-7 minutes video is now posted on how to use the trailing stop feature in our AT ( Active Trader) platform, along with small example of how I use overbought/ oversold conditions along with support and resistance to enter trades.

Any feedback is welcomed as we plan on producing additional educational videos


2. Support and Resistance Levels – S&P, Nasdaq, Dow Jones, Russell 2000

Contract (Dec. 2011) SP500
(big & Mini)
Nasdaq100
(big & Mini)
Dow Jones
(big & Mini)
Mini Russell
Resistance Level 3 1356.83 2587.17 12903 835.20
Resistance Level 2 1351.77 2577.83 12862 830.10
Resistance Level 1 1348.13 2572.67 12838 823.40
Pivot Point 1343.07 2563.33 12797 818.30
Support Level 1 1339.43 2558.17 12773 811.60
Support Level 2 1334.37 2548.83 12732 806.50
Support Level 3 1330.73 2543.67 12708 799.80

Continue reading “New Video | Support and Resistance Levels”

Tuesday Morning Support and Resistance Numbers

Here’s a morning cup o’ joe for all you futures traders, our morning support and resistance levels. Good trading!

divider black 190

Support and Resistance Levels – S&P 500, Nasdaq 100, Dow Jones, Mini Russell 2000, 30-Year US Bond, 10-Year US Note

Contract (Mar. 2012) Mini S&P 500 Mini Nasdaq 100 Dow Jones Mini Russell 2000 30-Year US Bond 10-Year US Note
Resistance Level 3—————————————— Resistance Level 2——————————————

Resistance Level 1

——————————————

Support Level 1

——————————————

Support Level 2

——————————————

Support Level 3

13641358.75


1353


1345.25


1340.75


1333.75

26482583.50


2575


2559


2550


2535

1300112894


12866


12804


12783


12734

843.40832


825


819.5


815.9


810.3

1440614321


14303


14217


14207


14120

1312613121.5


13116


13104


13031.5


13028.5

Continue reading “Tuesday Morning Support and Resistance Numbers”

Mini Nasdaq 100 | Support and Resistance Levels

Jump to a section in this post:
1. Market Commentary
2. Support and Resistance Levels – S&P, Nasdaq, Dow Jones, Russell 2000
3. Support and Resistance Levels – Gold, Euro, Crude Oil, T-Bonds
4. Support and Resistance Levels – March Corn, March Wheat, Jan Beans, March Silver
5.Economic Report for February 10, 2012

1. Market Commentary

Hello Traders,

Hope everyone had a good start for their week.

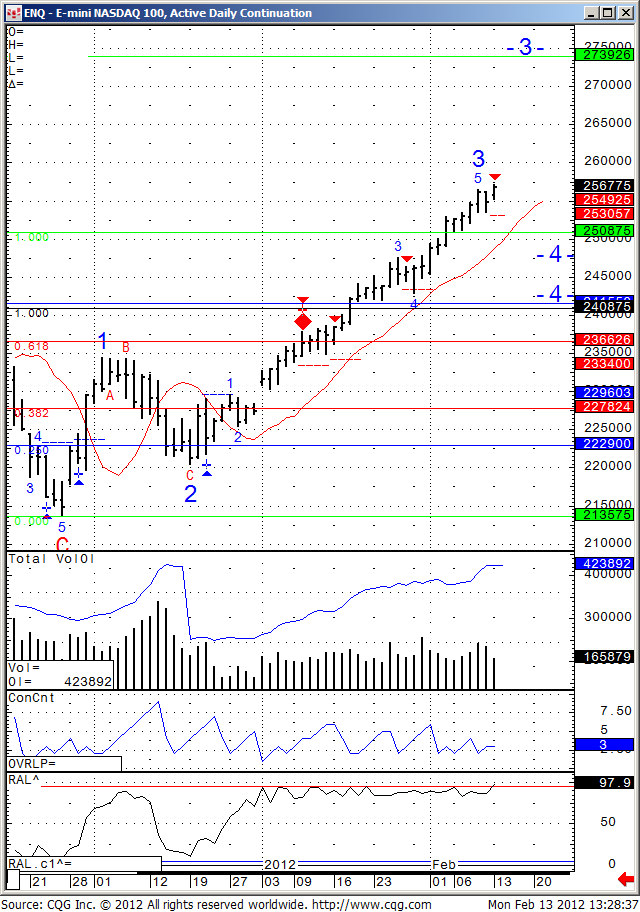
Below is a daily chart of the Mini Nasdaq 100.

Its been almost a straight line up BUT notice how the open interest is increasing and volume is actually declining….Sometimes that can be a sign that a strong correction may happen.

I would NOT try to fight the current uptrend but if I see this market breaking below 2530 over the next couple of days, I would feel stronger about the short side for a correction.

Market Commentary Continue reading “Mini Nasdaq 100 | Support and Resistance Levels”

Monday Morning Support and Resistance Numbers

Here’s a morning cup o’ joe for all you futures traders, our morning support and resistance levels. Good trading!

divider black 190

Support and Resistance Levels – S&P 500, Nasdaq 100, Dow Jones, Mini Russell 2000, 30-Year US Bond, 10-Year US Note

Contract (Mar. 2012) Mini S&P 500 Mini Nasdaq 100 Dow Jones Mini Russell 2000 30-Year US Bond 10-Year US Note
Resistance Level 3—————————————— Resistance Level 2——————————————

Resistance Level 1

——————————————

Support Level 1

——————————————

Support Level 2

——————————————

Support Level 3

13641358.75


1353


1345.25


1340.75


1333.75

26482583.50


2570


2556


2548


2535

1300112931


12894


12825


12804


12765

843.40832


823.7


818.2


815.2


810.3

1432114303


14217


14203


14119


14023

1311613108.5


13106.5


13101


13029.5


13015.5

Continue reading “Monday Morning Support and Resistance Numbers”

STOPS: Why Don’t We Keep Them | Support and Resistance Levels

Jump to a section in this post:
1. Market Commentary
2. Support and Resistance Levels – S&P, Nasdaq, Dow Jones, Russell 2000
3. Support and Resistance Levels – Gold, Euro, Crude Oil, T-Bonds
4. Support and Resistance Levels – March Corn, March Wheat, Jan Beans, March Silver
5.Economic Report for February 10, 2012

1. Market Commentary

Hello Traders,

Wishing everyone a great weekend and good trading week to come.

Another article we published before but the information is timeless, for your weekend reading pleasure:

STOPS: Why Don’t We Keep Them
by RealityTrader on Jan 19, 2011

With everything said and written on the subject of stops, it should be a given that everyone is conditioned to keep them religiously even before they start trading. No matter what source a newer trader turns to, utter importance of stops will be underlined and emphasized up to the degree that keeping them heralded as the ultimate key to success. We all heard adages like “Take care of your losses, profits will take care of themselves.”

Do all the stern warnings work? Not really.

Time and again traders blow their stops, widen them in the course of a trade, hold losing position in the false hope for recovery. If this destructive behavior continues despite all the warnings, there must be deeply rooted reasons for this. As with most trading flaws, failure to keep stops roots in fundamental misconceptions about the very nature of the market and trading. Such misconceptions result in incorrect psychological makeup which, in turn, creates behavioral patterns harmful for a trader’s performance. In order to re-condition oneself it is necessary to work out fundamental, even philosophical if you will, understanding of the market as an environment in which a trader operates.

Let us list and analyze the misconceptions that cause failure to keep stops. Continue reading “STOPS: Why Don’t We Keep Them | Support and Resistance Levels”

March Crude Oil Futures | Support and Resistance Levels

Jump to a section in this post:
1. Market Commentary
2. Support and Resistance Levels – S&P, Nasdaq, Dow Jones, Russell 2000
3. Support and Resistance Levels – Gold, Euro, Crude Oil, T-Bonds
4. Support and Resistance Levels – March Corn, March Wheat, Jan Beans, March Silver
5.Economic Report for February 10, 2012

1. Market Commentary

Hello Traders,

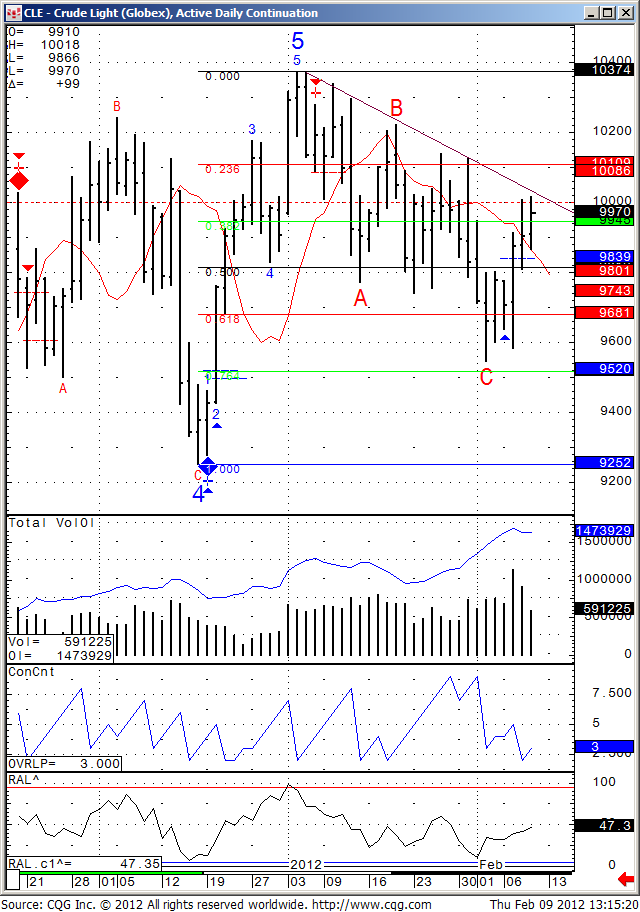
With stock index futures being relatively quiet, I am sharing a daily chart of March Crude Oil futures where volatility is still present.

My outlook on the daily chart is that a break above the trend line seen ( 100.34) can trigger more upside potential. On the other hand failure and a break of 98 going down can trigger new lows.

Market Commentary Continue reading “March Crude Oil Futures | Support and Resistance Levels”

Friday Morning Support and Resistance Numbers

Here’s a morning cup o’ joe for all you futures traders, our morning support and resistance levels. Good trading!

divider black 190

Support and Resistance Levels – S&P 500, Nasdaq 100, Dow Jones, Mini Russell 2000, 30-Year US Bond, 10-Year US Note

Contract (Mar. 2012) Mini S&P 500 Mini Nasdaq 100 Dow Jones Mini Russell 2000 30-Year US Bond 10-Year US Note
Resistance Level 3 —————————————— Resistance Level 2——————————————Resistance Level 1

——————————————

Support Level 1

——————————————

Support Level 2

——————————————

Support Level 3

13531346


1341.75


1331


1329.5


1324.25

2565.52555.5


2548


2531


2513


2497

1289412835


12799


12734


12685


12635

860.00843.4


832


820.2


814.9


802.70

1432114303


14226


14200


14125


14117

1312613121


13114.5


13025


13023


13015.5

Continue reading “Friday Morning Support and Resistance Numbers”

Thursday Morning Support and Resistance Numbers

Here’s a morning cup o’ joe for all you futures traders, our morning support and resistance levels. Good trading!

divider black 190

Support and Resistance Levels – S&P 500, Nasdaq 100, Dow Jones, Mini Russell 2000, 30-Year US Bond, 10-Year US Note

Contract (Mar. 2012) Mini S&P 500 Mini Nasdaq 100 Dow Jones Mini Russell 2000 30-Year US Bond 10-Year US Note
Resistance Level 3 ——————————————Resistance Level 2——————————————

Resistance Level 1

——————————————

Support Level 1

——————————————

Support Level 2

——————————————

Support Level 3

1363.751354.5


1353


1338.5


1331


1324.5

2562.52548.5


2539


2522


2505


2476

1300012907


12894


12789


12734


12635

860.00843.4


832


820.2


814.9


802.70

1431414231


14214


14123


14113


14021

1311713111


13104


13025


13023


13015.5

Continue reading “Thursday Morning Support and Resistance Numbers”

Risk with Trading | Support and Resistance Levels

Jump to a section in this post:
1. Market Commentary
2. Support and Resistance Levels – S&P, Nasdaq, Dow Jones, Russell 2000
3. Support and Resistance Levels – Gold, Euro, Crude Oil, T-Bonds
4. Support and Resistance Levels – March Corn, March Wheat, Jan Beans, March Silver
5.Economic Report for February 8, 2012

1. Market Commentary

Hello traders,

Another up day on LOW VOLUME…..

Not much to share as far as market view so another educational piece for your reading pleasure below:

RISK

It is a four letter word. As traders it is something that we thrive on and dread. We chase and fear. We look for and look to avoid. It is RISK. Without it, there is no opportunity for profit. Without it trading lacks potential. With it, failure and heartache are the consequences when it is abused.
Risk itself is not a bad thing. When it is misused by traders, it becomes a problem. Controlled risk presents traders with exciting and profitable opportunities. Uncontrolled, it brings the end to the dreams and careers of many traders.
How should we as traders confront risk? The first step is to respect it. Realize the damage it can do to our account equities when it is abused. The two most important tools that we have to control risk are stops and position size. Oh, I know, you hate stops. We all do. We have all been stopped out at the high or low only to see the market immediately move in the direction that we thought it would. But without using stops on every trade that we enter, disaster will eventually prevail. I have a love/hate relationship with my stop orders. I hate to place them, but love how they save me from large, unacceptable account crushing losses. It is the same for all successful traders. Those foolish enough to trade without stop protection are risking disaster on every trade. Unless you as a trader have developed perfect discipline to exit a losing trade quickly, and according to your pre-entry criteria, stops are mandatory. And admit it, at least to yourself…..do you have perfect discipline? I think not.
The other critical element in controlling risk is position size. By this I mean the percentage of your equity that you are risking per trade. I do not risk more than 3.5% of my equity on any trade. Some traders are comfortable risking 5% of their equity. This amount for me is an amount of risk with which I am comfortable. It allows for aggressive trading, and it allows me to stay in the game ( financially and psychologically) even after a series of losses. This aspect of strategy building is often forgotten by the novice trader. These folks have dreams of “the big hit” or the monster trade that allows their account equity to soar to heights unimagined by mere mortals. The problem is, oops, what if you are wrong? This type of trading/thinking is out of control. It leads to broken dreams and short careers. You must always remember that this is a highly volatile, sophisticated business. Treat it as such. If you want to gamble, jump on an airplane and visit Las Vegas.
The futures markets are highly leveraged, as we all know. Those traders that abuse risk by not respecting its power will eventually join the long list of former futures traders. Risk must be treated like a beautiful, intelligent woman. Treated with respect, wonderful things can happen. But, abuse it, or disrespect it, and suffer the consequences.
As a futures trader you have to embrace taking risk. Understand its impact. Respect it. Stay in control of it. Develop a trading method that makes risk an asset to your account instead of an enemy of your account. Risk/reward analysis is an important part of our everyday lives. Can I make it thru the intersection before the light turns red? Do I need to re-apply my sunscreen? Should I have one more beer before driving home? In trading, always keep in mind your risk versus the reward. A 50% gain in your account is not equal to a 50% loss of equity. A 50% winning trade puts you up by one half. But a 50% loss means that you have to double your equity to get back to your starting point. Respect your risk levels. Trade only using a risk level that you, personally, are comfortable with.
Rome wasn’t built in a day. Neither will your account be built in a day, or a week. Respect risk. Enjoy it’s benefits and may your trading in 2012 will produce profits and satisfaction. Enjoy the ride.

2. Support and Resistance Levels – S&P, Nasdaq, Dow Jones, Russell 2000

Contract (Dec. 2011) SP500
(big & Mini)
Nasdaq100
(big & Mini)
Dow Jones
(big & Mini)
Mini Russell
Resistance Level 3 1363.33 2560.17 12988 840.63
Resistance Level 2 1354.52 2547.33 12919 835.17
Resistance Level 1 1349.63 2537.67 12876 831.23
Pivot Point 1340.82 2524.83 12807 825.77
Support Level 1 1335.93 2515.17 12764 821.83
Support Level 2 1327.12 2502.33 12695 816.37
Support Level 3 1322.23 2492.67 12652 812.43

Continue reading “Risk with Trading | Support and Resistance Levels”