Jump to a section in this post:
1. Market Commentary
2. Support and Resistance Levels – S&P, Nasdaq, Dow Jones, Russell 2000
3. Support and Resistance Levels – Gold, Euro, Crude Oil, T-Bonds
4. Support and Resistance Levels – March Corn, March Wheat, Jan Beans, March Silver
5.Economic Report for March 1, 2012
Happy Leap Day!
Hello Traders,
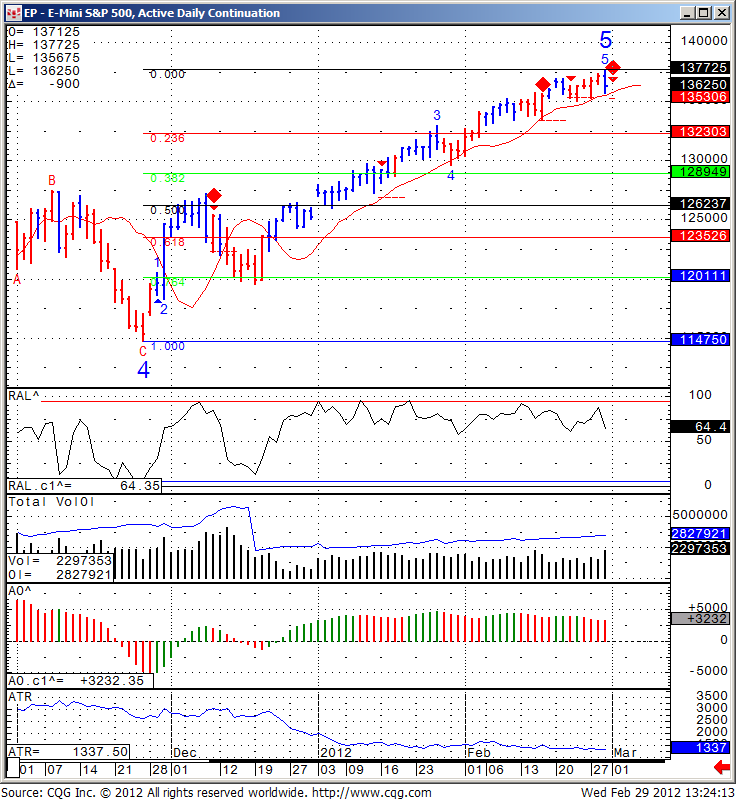
Daily chart of the Mini SP500 for your review below.
After more than a few narrow trading sessions on relatively low volume, we had a small reversal and breakout to the down side on above than avg. volume.
I would look to be a seller as a swing trading idea if the market breaks below 1356.
My recommended stop would be 1379.00 and my initial target would be 1323 followed by 1289.
Of course this is just my opinion using technical analysis and each trader should make their own trading decision based on their risk tolerance and their own judgment but I thought I would share it with the blog readers.
