Cannon Trading / E-Futures.com
Wishing all of you a great trading month in March!
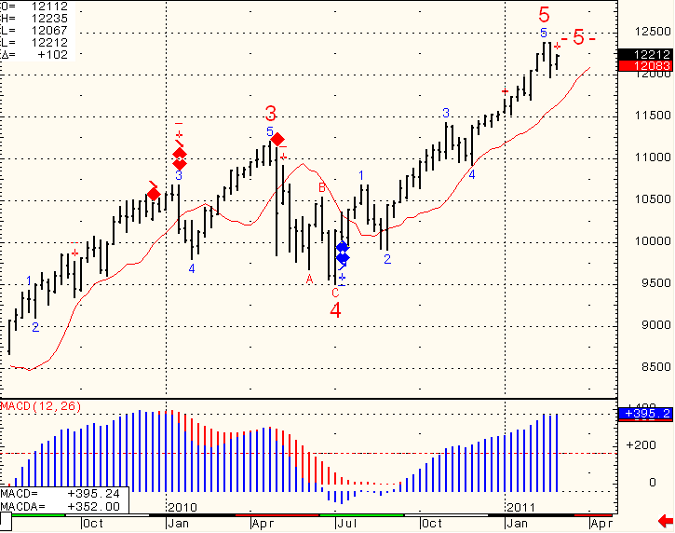
Weekly chart of mini Dow Jones futures for your review below. While most of you are shorter term traders, even considered futures day-traders, it is wise to know what the longer time frame charts are showing as well.
In the case of the weekly chart below, we will need to see a break below 119.50 in order to get a weekly sell signal according to my technical opinion.
