____________________________________________________________________
Voted #1 Blog and #1 Brokerage Services on TraderPlanet for 2016!!
____________________________________________________________________
Dear Traders,
A picture is worth a thousand words….
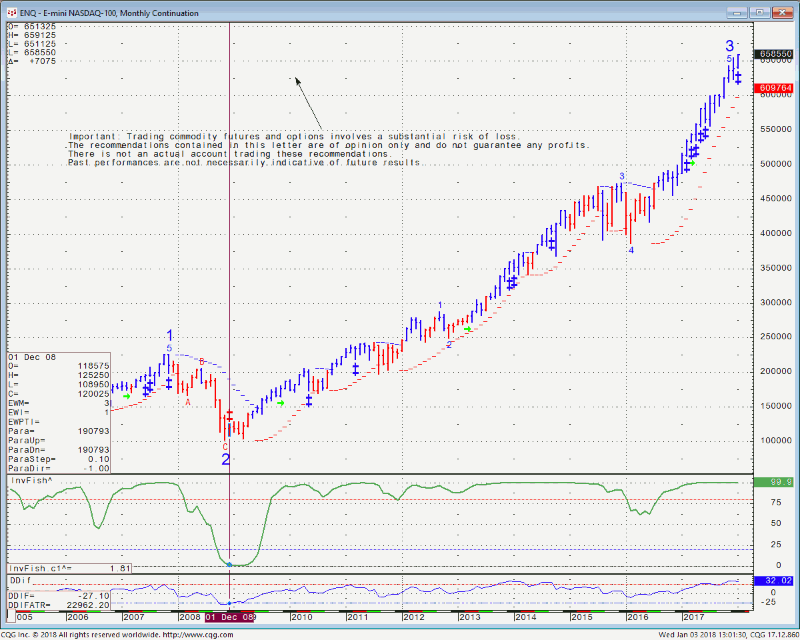
A look at the monthly mini NASDAQ 100 chart below illustrates the amazing rally we had since 2008.
The last technical sell signal on the monthly chart was late 2008…since then, you can see more than a few buy signals on this rally ( blue plus signs and green arrows), which in my opinion, was initiated and fueled by the Fed. to a large extent.
mini NASDAQ monthly chart:
