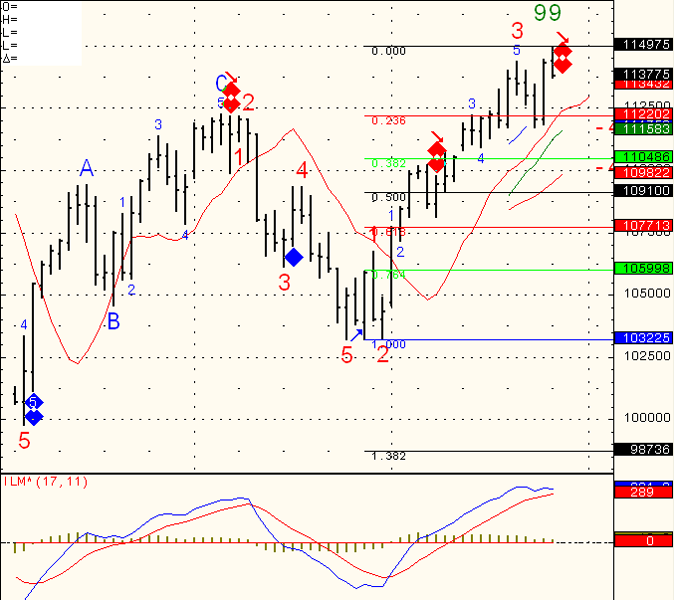
Daily chart of Mini SP below. As I mentioned last week, I got a couple of potential “sell signals” and the market only gave us a small decline if that. What is being referred to as “divergence”. Well…I got one more potential for market retracement.
This time the SP will have to drop below 1123 in order for me to enter a short swing position. I call it price conformation. Meaning I would like to see price action confirming my technical speculation. FIB levels on the chart will be used to determine potential targets, stops etc.

Continue reading “Price Levels for Futures Trading, September 28th 2010”