Cannon Trading / E-Futures.com
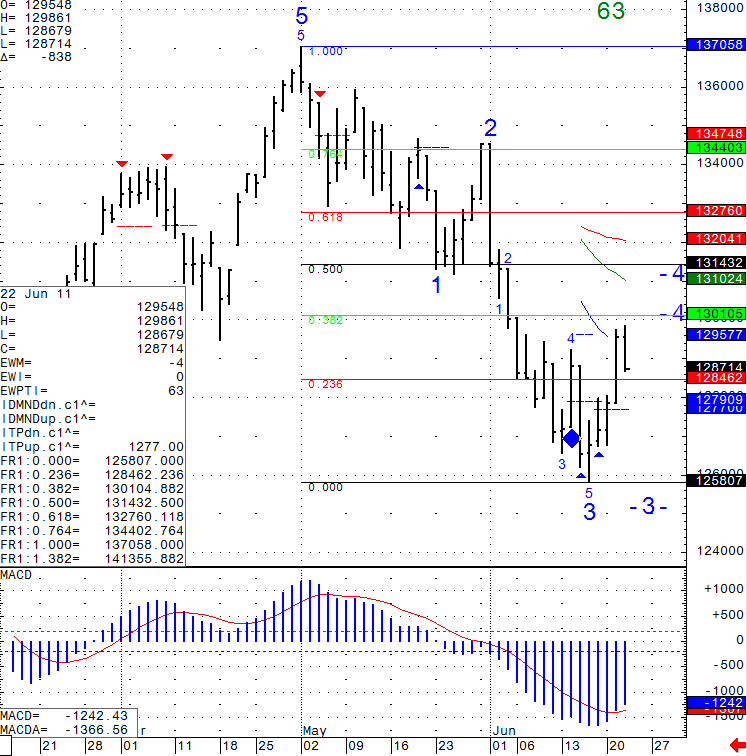
Once in a while I like to take a look at the actual underlying product for the future I am trading. In the case of the mini SP500, the actual product is the SP500 cash index. Below is a daily chart of the SP500 cash index, courtesy of CQG charting software.
Based on the tools I use and have confidence in, I will look for failure against the 1301 level and/ or a break back below 1284 as a sign that selling may resume towards the previous lows around 1258 cash basis. As always, use your own judgement in trading, know the time frame you like to trade, your risk tolerance etc.
Daily Chart of the S&P 500 Cash Index from June 22nd 2011
 Continue reading “Futures Trading Levels, Looking at the Underlying Product of Futures”