Commentary will resume tomorrow.
Continue reading “Futures and Commodity Trading Levels for October 6th 2010”
Commentary will resume tomorrow.
Continue reading “Futures and Commodity Trading Levels for October 6th 2010”
Not an easy market to read right now in my opinion.
It is showing signs like it would like to visit some lower levels, yet there is enough buying interest to keep it above 1127.
This Friday monthly unemployment levels will be watched closely.
If the market breaks below 1127, it has a chance of picking some more speed to the downside.
On the flip side, bulls will need to see new highs in order to get back in control of price action.
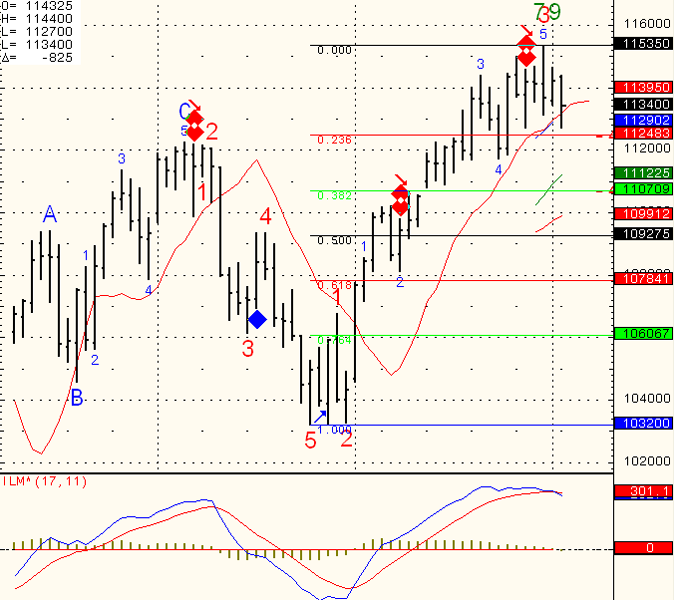
Daily chart with some price levels to watch for your review below:
Continue reading “Commodity Trading Levels for October 5th 2010”
I wish all of you a great trading month in October.
If the first trading of October is an indication for the rest of the month, than October should be an interesting month….
Currently there is a case for both the bulls and the bears.
Bull camp needs to see a close above 1150 while bear camp needs to see a break below 1125. In between it is an open game for moves in both directions.
I wanted to share some of today’s activity we had in the daily webinar service I hold. The “webinar” is a service I offer, where I share mostly the mini SP chart but also other markets like Euro currency, Crude Oil and Mini Russell.
In the webinar I display my charts, trading indicators, trading algorithm, trade management philosophy, risk management and more.
Some days i also provide live trading examples using my demo, like I did today.
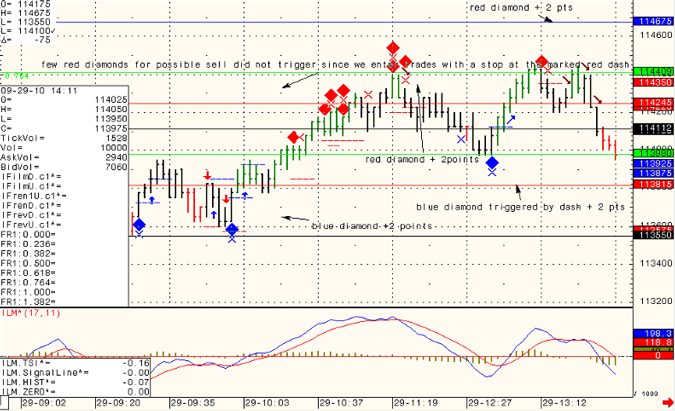
Below you will see a segment from today’s webinar where the DIAMOND algorithm provided us with more than several trade set ups for 2 mini SP points each time.
For free trial and more information, visit: https://www.cannontrading.com/tools/intraday-futures-trading-signals
( NO REPEAT TRIALS )
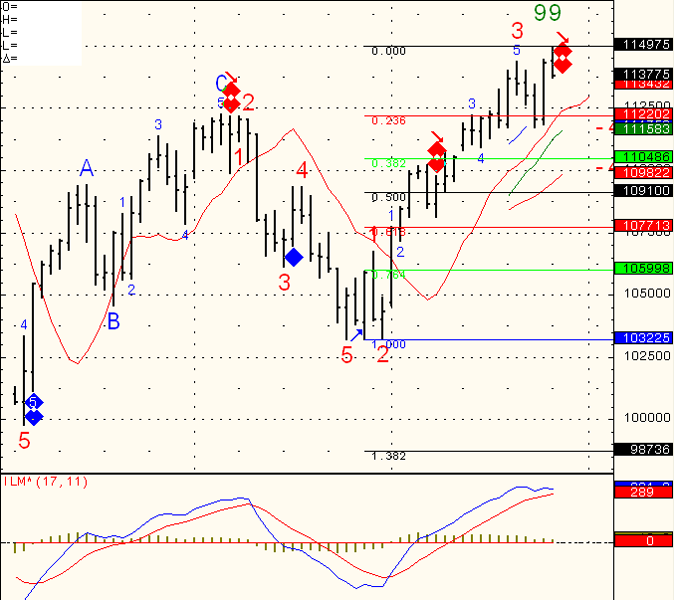
Daily chart of Mini SP below. As I mentioned last week, I got a couple of potential “sell signals” and the market only gave us a small decline if that. What is being referred to as “divergence”. Well…I got one more potential for market retracement.
This time the SP will have to drop below 1123 in order for me to enter a short swing position. I call it price conformation. Meaning I would like to see price action confirming my technical speculation. FIB levels on the chart will be used to determine potential targets, stops etc.
Continue reading “Price Levels for Futures Trading, September 28th 2010”
I got two “false” sell signals before this last one….I think the fact that we went through the first FIB level gives this short swing trade higher chances of being correct with initial target of 617.10.
Since NONE of us have a crystal ball, one always has to calculate the proper stop or risk allocated for the trade and see if it makes sense based on ones account size, risk tolerance etc.
For this specific one, I would conclude that my short trade is wrong if we trade above 660.
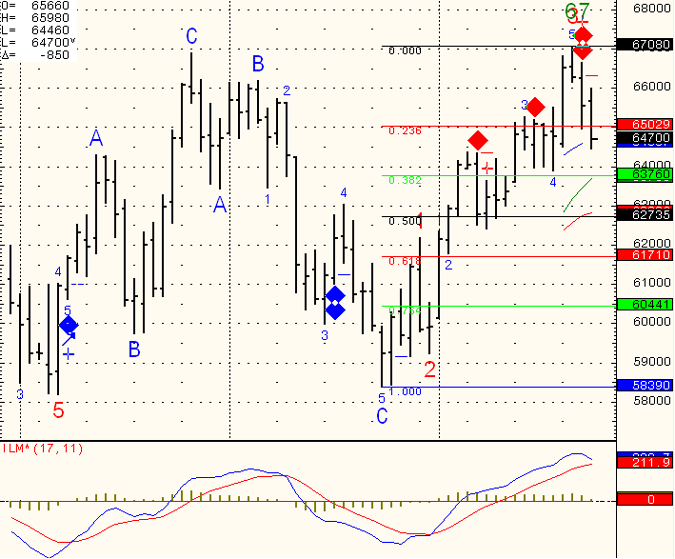
Continue reading “617.10 is Initial Target for FIB Level for Futures Trading, September 24th 2010”
FOMC is behind us. Mixed reaction from the market and many times the real direction will show the next day, so tomorrows price action is important to watch. My indicators suggest that as long as we can hold the 1115 level, we still have a shot at more upside move. However a break below 1115 on mini SP along with continued upside in bond market may suggest temporary top. Time and price will tell.
Continue reading “Watch for Price Action the Day After FOMC, September 22nd 2010”
FOMC tomorrow around 2:15 Eastern time. Even before that we will start the day with some important housing numbers. FOMC days have different characteristics than other trading days. If you have traded for a while, check your trading notes from past FOMC days that may help you prepare for tomorrow. If you are a newcomer, take a more conservative approach and make sure you understand that the news can really move the market. My observations suggest choppy, low volume up until announcement, followed by some some sharp volatile moves right during and after the announcement. I am including 5 minutes chart from August 10th of this year, which was the last FOMC we had for your reference. Continue reading “FOMC to Provide Futures Trading Market with Direction, September 21st, 2010”
Market finally broke to the upside but like always “tries to make it harder” for us traders…. The upside breakout lacked momentum and / or continuation, at least today. However, I have shifted my swing trading stance to cautiously bullish as long as SP500 can hold above 1105.75….
FOMC next Tuesday along with busy Thursday / Friday economic and speaking schedule.
Have a great weekend, take time to recharge the brain and “clean it” from all the ” I should have placed a stop at this price and i should have taken that trade” etc….Once a trader has a concept they feel good about, the rest of the battle is mostly mental one with yourself.
Continue reading “Futures and Commodity Trading Blog, September 20th 2010”
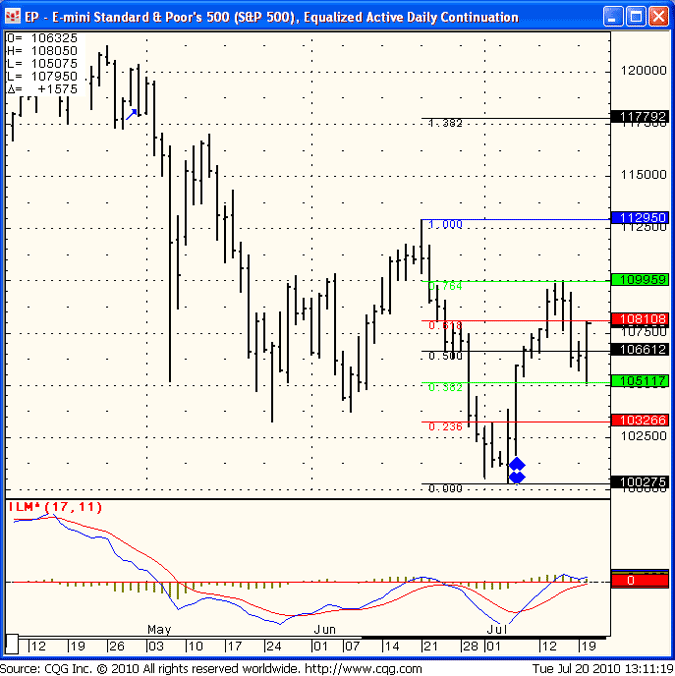
Nice bounce after touching some FIB levels during overnight session/early morning. FIBONACCI levels been providing good support/ resistance levels so far when applied over multiple time frames. ( daily, hourly, 15 minutes etc. )
Below is a daily chart of the E Mini S&P 500 futures contract with FIBONACCI levels drawn.
Notice todays lows and highs.
We are closing against highs and some momentum during the night session can help this market visit 1099. Failure against the 1081 level and we are back to range bound trading.
