More Volatitity after Holiday Weekend | Support and Resistance Levels

In this post:

1. Market Commentary
2. Support and Resistance Levels
3. Hourly Futures chart of PIT big S&P500
4. Economic Reports
5. Highlighted Earnings Releases

divider black 190

1. Market Commentary

Market came back from a long weekend with extra energy and extra volatility.

We gaped lower to start the session and then bounced most of the day after better than expected ISM.

At this point, there more than a few gaps on the daily chart to be filled in both directions.

I am looking at a “band” between 1183 and 1136 as we go into tonight’s and tomorrow session.

To be honest, I don’t have a feel on which way to play the market outside of day-trading set ups right now.

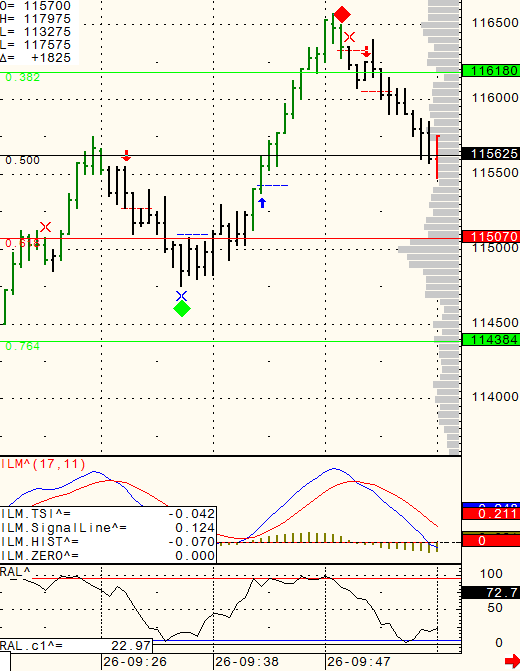
I share these set ups, like the one below using the hourly chart in my daily, live signals service.

Hourly chart of PIT (big SP500) for your review below: Continue reading “More Volatitity after Holiday Weekend | Support and Resistance Levels”

Bearish Close for the Mini Russell 2000 | Support and Resistance Levels

In this post:
1. Market Commentary
2. Support and Resistance Levels

3. Daily Futures Chart for Mini Russell 2000

4a. Economic Reports Monday September 5th
4b. Economic Reports Tuesday September 6th

1. Market Commentary

I wrote the following yesterday:
I am getting mixed signals from the chart perspective and there is a case both for the bulls and the bears.

The bulls need to hold above 1183.00 and break above 1215.75

The bears need to break below 1183.00 to have a shot at the 1142.50 level.

Well we broke below 1183 and closed right around 1172, which to me is a bearish close. However to keep things in perspective, this is pretty much the same price we traded at last Friday…..The next level the bulls must defend is 1132.75.

It will be interesting to see which direction this market takes after the long weekend.

Wishing all of you a great, long Labor Day weekend. recharge, relax, enjoy and see you next week! You can view the Labor Day 2011 futures trading hours below.

View Labor Day 2011 Holiday Futures Trading Hours

Daily chart of Mini Russell 2000 including a sell signal I got yesterday after the close for your review below.

divider black 190

2. Support and Resistance Levels!

Contract (Sept. 2011) SP500 (big & Mini) Nasdaq100 (big & Mini) Dow Jones (big & Mini) Mini Russell
Resistance 3 1198.23 2274.25 11745 730.13
Resistance 2 1191.62 2248.00 11631 719.77
Resistance 1 1181.93 2208.25 11426 700.33
Pivot 1175.32 2182.00 11312 689.97
Support 1 1165.63 2142.25 11107 670.53
Support 2 1159.02 2116.00 10993 660.17
Support 3 1149.33 2076.25 10788 640.73


Contract Dec. Gold Sept. Euro Oct. Crude Oil Dec. Bonds
Resistance 3 1916.9 1.4365 92.26 145 2/32
Resistance 2 1900.7 1.4326 90.62 142 23/32
Resistance 1 1892.7 1.4258 88.69 141 16/32
Pivot 1876.5 1.4219 87.05 139 5/32
Support 1 1868.5 1.4151 85.12 137 30/32
Support 2 1852.3 1.4112 83.48 135 19/32
Support 3 1844.3 1.4044 81.55 134 12/32

divider black 190

3. Daily Futures chart for Mini Russell 2000 from September 2nd, 2011
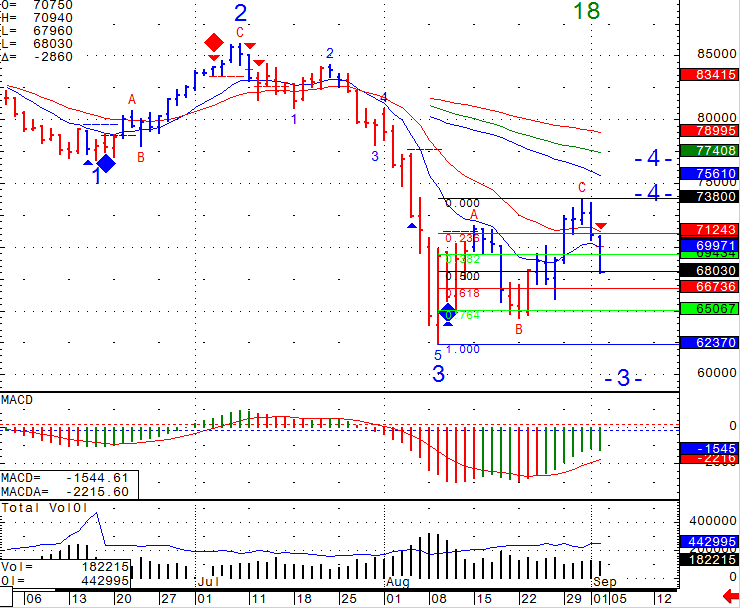
Daily Futures chart for Mini Russell 2000 from September 2nd, 2011

divider black 190

4a. Economic Reports Monday September 5th, 2011

Bank Holiday
8:30am USD

4b. Economic Reports Tuesday September 6th, 2011

ISM Non-Manufacturing PMI
10:00am USD

Economics Report Source: http://www.forexfactory.com/calendar.php

divider black 190

This is not a solicitation of any order to buy or sell, but a current market view provided by Cannon Trading Inc. Any statement of facts herein contained are derived from sources believed to be reliable, but are not guaranteed as to accuracy, nor they purport to be complete. No responsibility is assumed with respect to any such statement or with respect to any expression of opinion herein contained. Readers are urged to exercise their own judgment in trading!

Monthly Job Report May Move the Markets | Support and Resistance Levels

In this post:
1. Market Commentary
2. Daily Futures Chart for Mini S&P 500
3. Support and Resistance Levels
4. Economic Reports
5. Highlighted Earnings Releases

divider black 190

1. Market Commentary

Monthly unemployment is sure to move the market tomorrow morning…the big question is which way and to be honest , I have no idea…..

i am getting mixed signals from the chart perspective and there is a case both for the bulls and the bears.

The bulls need to hold above 1183.00 and break above 1215.75

The bears need to break below 1183.00 to have a shot at the 1142.50 level.

I am sure we can see wild and wide swings when the report comes out tomorrow morning before cash open and through out the trading session as large traders will try to square their positions ahead of the long, Labor day weekend.

When is doubt, stay out until you have a clearer picture of what you think the market will do.

See the Labor Day Holiday Trading Hours at our weekly newsletter.

divider black 190

2. Support and Resistance Levels!

Contract (Sept. 2011) SP500 (big & Mini) Nasdaq100 (big & Mini) Dow Jones (big & Mini) Mini Russell
Resistance 3 1246.43 2300.75 11865 758.03
Resistance 2 1237.22 2282.25 11785 746.57
Resistance 1 1220.73 2252.50 11635 728.53
Pivot 1211.52 2234.00 11555 717.07
Support 1 1195.03 2204.25 11405 699.03
Support 2 1185.82 2185.75 11325 687.57
Support 3 1169.33 2156.00 11175 669.53


Contract Dec. Gold Sept. Euro Oct. Crude Oil Dec. Bonds
Resistance 3 1853.5 1.4510 91.43 140 25/32
Resistance 2 1843.5 1.4444 90.66 139 4/32
Resistance 1 1835.4 1.4356 89.74 138 11/32
Pivot 1825.4 1.4290 88.97 136 22/32
Support 1 1817.3 1.4202 88.05 135 29/32
Support 2 1807.3 1.4136 87.28 134 8/32
Support 3 1799.2 1.4048 86.36 133 15/32

Continue reading “Monthly Job Report May Move the Markets | Support and Resistance Levels”

Higher Market Volatility During Labor Day Weekend | Support and Resistance Levels

In this post:

1. Market Commentary
2. Support and Resistance Levels
3. Economic Reports
4. Highlighted Earnings Releases

divider black 190

1. Market Commentary

Next two days are full of economic reports and ahead of Labor Day weekend.

I expect even higher volatility the next two trading days.

Wishing you a great trading month in September.

Our weekly newsletter, includes a good article on volume/ open interest along with Holiday Trading Hours.

Trading Futures, Options on Futures, and retail off-exchange foreign currency transactions involves substantial risk of loss and is not suitable for all investors. You should carefully consider whether trading is suitable for you in light of your circumstances, knowledge, and financial resources. You may lose all or more of your initial investment. Opinions, market data, and recommendations are subject to change at any time. Continue reading “Higher Market Volatility During Labor Day Weekend | Support and Resistance Levels”

Higher Volume in Futures Markets | Support and Resistance Levels

In this post:
1. Market Commentary
2. Daily Futures Chart for Mini S&P 500
3. Support and Resistance Levels
4. Economic Reports
4. Highlighted Earnings Releases

divider black 190

1. Market Commentary

Interesting price action today.

Market visited both positive and negative territory with better volume than last few sessions.

Market made recent highs at 1218.75 yet finished slightly lower to unchanged.

Tomorrow is the last trading day of the month.

Overall as one can see from chart below, open interest has risen since we first sold off hard, while volume has dropped since the sell off during the first few days of August.

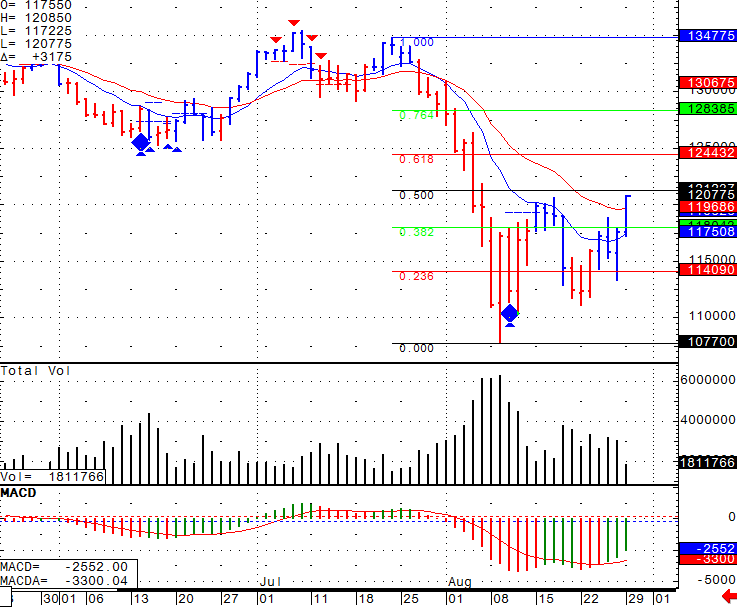
What does it mean to me? My guess is that the bounce we have seen after the 1077 Aug 9th low on the SP500 is a bear market rally. While we may see a bounce to 1244 -1283 levels, I feel there are bigger chances for the downtrend to resumeand for the market to visit Aug 9th lows and perhaps lower.

As always the “Million $$ questions” are:

When does one enter?

How does one protect oneself in case this analysis is wrong?

How does one manage the trade once one has answered the first two questions above….

divider black 190

2. Support and Resistance Levels!

Contract (Sept. 2011) SP500 (big & Mini) Nasdaq100 (big & Mini) Dow Jones (big & Mini) Mini Russell
Resistance 3 1244.33 2300.83 11823 755.33
Resistance 2 1231.42 2275.17 11721 743.47
Resistance 1 1219.83 2252.58 11620 734.03
Pivot 1206.92 2226.92 11518 722.17
Support 1 1195.33 2204.33 11417 712.73
Support 2 1182.42 2178.67 11315 700.87
Support 3 1170.83 2156.08 11214 691.43


Contract Dec. Gold Sept. Euro Oct. Crude Oil Dec. Bonds
Resistance 3 1865.0 1.4672 92.56 138 10/32
Resistance 2 1850.7 1.4601 90.88 137 29/32
Resistance 1 1845.6 1.4522 89.81 137 16/32
Pivot 1831.3 1.4451 88.13 137 3/32
Support 1 1826.2 1.4372 87.06 136 22/32
Support 2 1811.9 1.4301 85.38 136 9/32
Support 3 1806.8 1.4222 84.31 135 28/32

Continue reading “Higher Volume in Futures Markets | Support and Resistance Levels”

Key Resistance Level in Futures Trading Price Action | Support and Resistance Levels

Market rallied close to 3% on the SP and Dow Jones. Again it did so on much lighter volume than when it sold off last few weeks but nonetheless one CANNOT argue with price action. We are approaching the 50% retracement level from the highs made on July 8th to lows made Aug 9th. That level on the mini SP is 1212.50. I believe that the 1212 to 1219 zone is an important resistance level to watch. If we break above it with meaningful volume, it may be a sign of further room to the upside, on the other hand if we fail against it and volume picks up with price action going lower, it may be a sign of resumed selling. As always in our business… time will tell. Plenty of economic reports this week, both in the US and in Europe. Last but not least it is the end of the month…. Wishing you great trading this week and Daily chart of the mini SP 500 for your review below.

Daily Futures chart for Mini S&P 500 from August 29th, 2011

Daily Futures chart for Mini S&P 500 from August 29th, 2011

Trading Futures, Options on Futures, and retail off-exchange foreign currency transactions involves substantial risk of loss and is not suitable for all investors. You should carefully consider whether trading is suitable for you in light of your circumstances, knowledge, and financial resources. You may lose all or more of your initial investment. Opinions, market data, and recommendations are subject to change at any time. Continue reading “Key Resistance Level in Futures Trading Price Action | Support and Resistance Levels”

Using Algorithms During High Market Volatility | Support and Resistance Levels

Another day full of two sided moves and volatility.

This type of trading action works well for a set of studies/ ALGO I developed.

You can see a screen shot below which pretty much speaks for itself.

Minute Futures chart for 10,000 Contracts CVB from August 26th, 2011

Minute Futures chart for 10,000 Contracts CVB from August 26th, 2011

I share my studies and ALGO in two ways.

The first is by having a daily live chart service, where subscribers/ trial members get a unique invitation to view my screen along with live charts, trade signals and trade philosophy. I call it live webinar.

The second method is available for sierra charts / ATcharts users . Those who are interested will get my ALGO/ study pac via email and will be able to apply it on their sierra charts for different markets, different time frames etc.

Both methods are available for a free trial if you did not have one yet.

To read more and request a trial, visit our futures trading webinar page or simply send me an email with your sierra/ ATcharts user name.

Have a great weekend!

Trading Futures, Options on Futures, and retail off-exchange foreign currency transactions involves substantial risk of loss and is not suitable for all investors. You should carefully consider whether trading is suitable for you in light of your circumstances, knowledge, and financial resources. You may lose all or more of your initial investment. Opinions, market data, and recommendations are subject to change at any time. Continue reading “Using Algorithms During High Market Volatility | Support and Resistance Levels”

Market Volatility During the Jackson Hole Symposium | Support and Resistance Levels

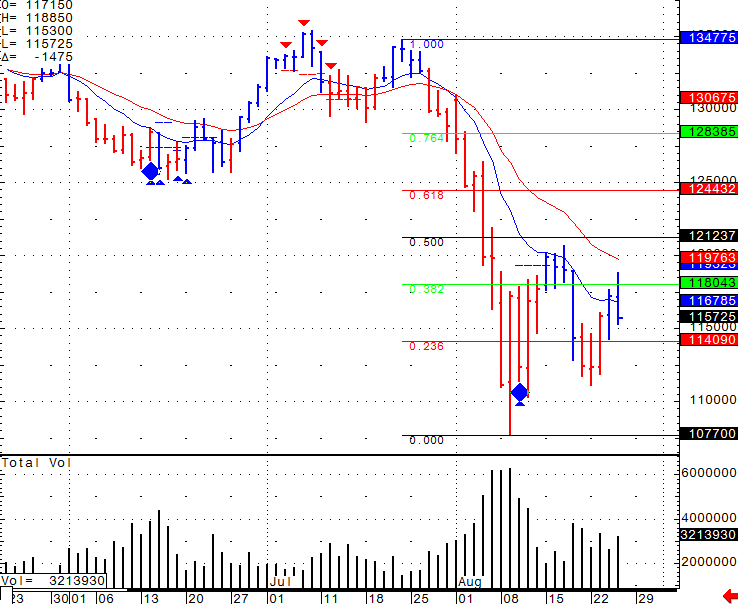
I am going to write exactly what I shared yesterday. VALID and worthy….but to add I also included a chart of the mini SP with some levels to watch for. 1197 is my resistance and 1141 is support. As mentioned below, we expect HIGH VOLATILITY!

We expect volatility to peak as we approach Friday, ahead of the weekend with Fed Chairman Bernanke speaking In Jackson Hole and Quarterly GDP numbers due early.

Plan for the unexpected. If you are a swing / position trader make sure you have enough “cushion” to sustain these volatile moves and make sure you understand your margin requirements and obligations.

On a different note, GREAT article about “Beliefs” and Trading by Dr. Janice Dorn in our weekly newsletter.

Daily Futures chart of the S&P 500 from August 25th, 2011

Daily Futures chart of the S&P 500 from August 25th, 2011

Trading Futures, Options on Futures, and retail off-exchange foreign currency transactions involves substantial risk of loss and is not suitable for all investors. You should carefully consider whether trading is suitable for you in light of your circumstances, knowledge, and financial resources. You may lose all or more of your initial investment. Opinions, market data, and recommendations are subject to change at any time. Continue reading “Market Volatility During the Jackson Hole Symposium | Support and Resistance Levels”

Trading Beliefs and Market Volatility | Support and Resistance Levels

We expect volatility to peak as we approach Friday, ahead of the weekend with Fed Chairman Bernanke speaking In Jackson Hole and Quarterly GDP numbers due early.

Plan for the unexpected. If you are a swing / position trader make sure you have enough “cushion” to sustain these volatile moves and make sure you understand your margin requirements and obligations.

On a different note, GREAT article about “Beliefs” and Trading by Dr. Janice Dorn in our weekly newsletter.

Trading Futures, Options on Futures, and retail off-exchange foreign currency transactions involves substantial risk of loss and is not suitable for all investors. You should carefully consider whether trading is suitable for you in light of your circumstances, knowledge, and financial resources. You may lose all or more of your initial investment. Opinions, market data, and recommendations are subject to change at any time. Continue reading “Trading Beliefs and Market Volatility | Support and Resistance Levels”

Online Futures Trading Support and Resistance Levels for August 25th 2010

“We Met the Initial Target of 1049”

Yesterday I mentioned the following:

Daily chart of the mini Russell, which I consider the leader, for review below. Looks like we may get a test of previous lows and if and then the big question.. do we bounce or do we start a new leg lower:

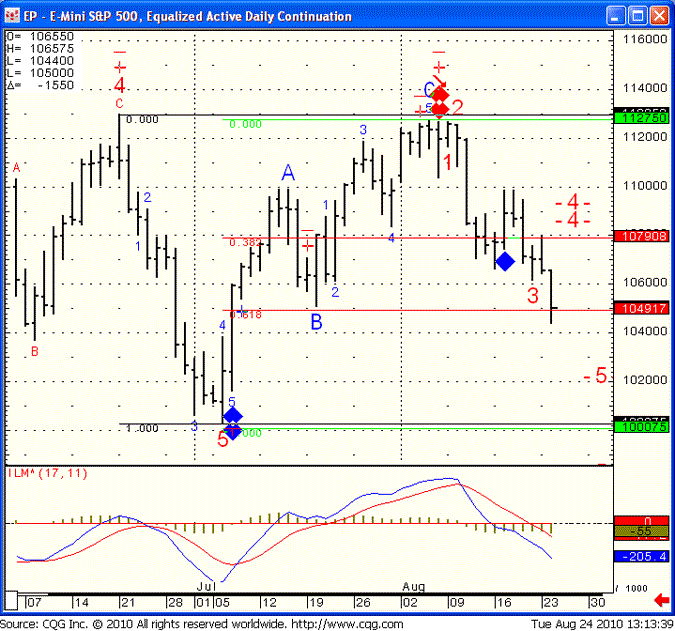
Well the big question for this point in time is here.. we met the initial target of 1049 and from a technical point of view we are looking at some wide bands. 1049 being pivot line, 1080 being resistance and 1000.75 being major support.

Today I am sharing daily chart of the mini SP 500 for review:

to sign for free trail, visit: https://www.cannontrading.com/tools/intraday-futures-trading-signals

EP - E- Mini S&P 500, Equal Active Daily Continuation
EP – E- Mini S&P 500, Equal Active Daily Continuation

Continue reading “Online Futures Trading Support and Resistance Levels for August 25th 2010”