Trading Levels and Economic Reports for April 3, 2013


Jump to a section in this post:

1. Market Commentary
2. Support and Resistance Levels – S&P, Nasdaq, Dow Jones, Russell 2000, Dollar Index
3. Support and Resistance Levels – Gold, Euro, Crude Oil, T-Bonds
4. Support and Resistance Levels – Corn, Wheat, Beans, Silver
5. Economic Reports for Wednesday April 3, 2013


Hello Traders,

For 2013 I would like to wish all of you discipline and patience in your trading! 

So far most selling in stock index futures are met with volume buying at lower levels. I wish I had an idea of how long this would last….but I don’t. What can change the dynamics are the few employment reports we have this week. Starting with tomorrow ADP report, Thursday weekly report and non-farm payroll (the big report) this
Friday.
Be aware of when the different reports come out and their importance. I post the upcoming reports in this blog and I like using forexfactory.com as a source as well as when I do research about past reports.


Trading Levels and Reports for May 25th – Memorial Day Trading Schedule

Jump to a section in this post:

1. Market Commentary
2. Support and Resistance Levels – S&P, Nasdaq, Dow Jones, Russell 2000, Dollar Index
3. Support and Resistance Levels – Gold, Euro, Crude Oil, T-Bonds
4. Support and Resistance Levels – Corn, Wheat, Beans, Silver
5. Economic Reports for Friday May 25, 2012

Hello Traders,

Just a heads up!  This weekend is Memorial Day weekend and of course we are on a Holiday Schedule.  Please pay attention below to the Memorial Day Trading Schedule.

Memorial Day Trading Schedule

Friday, May 25

CME Group (Floor)
12:00 pm Close: Foreign Exchange and Interest Rate products
* All other products regular close

NYMEX (Floor)
Regular Close

GLOBEX
3:15 pm Close: Interest Rate, Foreign Exchange, CBOT/KCBT/MGEX Grain, GSCI, Wood Pulp, Crude Palm Oil and Green Exchange products
* All other products regular close

ICE
3:15 pm Close: Financial and Index products
* All other products regular close

EUREX
Regular Close

OneChicago
Regular Close

NYSE
Regular Close

Nadex
Regular Close

Forex
Regular Close

Sunday, May 27

CME Group (Floor)
Closed

NYMEX (Floor)
Closed

GLOBEX
Regular Open
* Exceptions – Dairy, Crude Palm Oil, Weather, Livestock, GSCI, Lumber, CBOT/KCBT/MGEX Grains and Dow UBS ER products closed

ICE
Regular Open
* Exceptions – Soft and Open outcry products closed

EUREX
Regular Open
* Exceptions – Swiss fixed income as well as equity and equity index derivatives, Hurricane Futures, Austrian, Norwegian, Brazilian, Canadian and U.S. equity derivatives and Eurex KOSPI Products (No cash payment in USD, CHF, KRW)

OneChicago
Closed

NYSE
Closed

Nadex
Closed

Forex
Regular Open

Monday, May 28

CME Group (Floor)
Closed

NYMEX (Floor)
Closed

GLOBEX
Closed: Dairy, Crude Palm Oil, Livestock, GSCI, Lumber, Weather, CBOT/KCBT/MGEX Grains, KOSPI 200 and Dow UBS ER products
10:30 am Close: Equity products
12:00 pm Close: Interest Rate, Foreign Exchange, Real Estate and Wood Pulp products
12:15 pm Close: NYMEX/COMEX/DME and Green Exchange products

*Trading Resumes at the times listed below*
5:00 pm Open: Equity, Interest Rate, Foreign Exchange, Dairy, Crude Palm Oil, GSCI, Weather, Real Estate, Wood Pulp, NYMEX/COMEX/DME and Green Exchange products
7:00 pm Open: CBOT/KCBT/MGEX Grain products (pre-open begins at 4:15 pm on Sunday, May 27th)

ICE
Closed: Soft and Open outcry products
10:30 am Close: Index products
12:00 pm Close: Financial products

EUREX
Closed: Swiss fixed income as well as equity and equity index derivatives, Hurricane Futures, Austrian, Norwegian, Brazilian, Canadian and U.S. equity derivatives and Eurex KOSPI Products
*No cash payment in USD, CHF, KRW

OneChicago
Closed

NYSE
Closed

Nadex
Closed
*Regular evening open at 5:00 pm

Forex
Regular Close


CME Group  Schedule

ICE Schedule


*All times listed in Central Time

The above calendar is compiled from sources believed to be reliable. Cannon Trading Co, Inc.  assumes no responsibility for any errors or omissions. It is meant as an alert to events that may affect trading strategies and is not necessarily complete. The closing times for certain contracts may have been rescheduled.

If you have any questions please contact our Customer Service Continue reading “Trading Levels and Reports for May 25th – Memorial Day Trading Schedule”

Day Trading Education | Support and Resistance Levels

Jump to a section in this post:
1. Market Commentary
2. Support and Resistance Levels – S&P, Nasdaq, Dow Jones, Russell 2000
3. Support and Resistance Levels – Gold, Euro, Crude Oil, T-Bonds
4. Support and Resistance Levels – March Corn, March Wheat, Jan Beans, March Silver
5.Economic Report for February 2, 2012

1. Market Commentary

Many clients new and veteran have asked me in the past for different resources as far as day-trading education so I wanted to share a few pointers from my colleagues at Naturus.com about day-trading in general and day-trading futures in specific.
This ain’t rocket science. But it ain’t easy either.
Day-trading is just the process of buying and selling a futures contract within the same session.
It sounds pretty simple. If you buy and the price goes up you make money. Buy low, sell high (or sell high and buy low) and go fishing.
But knowing how it is done is not remotely close to knowing how to do it.
Learning to trade is a bit like learning to play the piano. You can’t learn by reading about it, or by watching somebody else do it, any more than you can lose weight by watching work-out videos.
You have to do it yourself, which means spending time – lots of time – in front of the screen, trading and analyzing. Experience isn’t just the best teacher; it is the only teacher.
The problem is that you can get hurt while you are learning. When you risk your money in the market, the guys taking the other side of your trade are much more experienced and much more skillful. They are pros, and there is no minor league where you can learn without getting hurt. Continue reading “Day Trading Education | Support and Resistance Levels”

Tuesday Morning Support and Resistance

Here’s a morning cup o’ joe for all you futures traders, our morning support and resistance levels. Good trading!

As always, if you’d like these numbers before the market opens for free (for the time being), sign up above.

divider black 190

Support and Resistance Levels – S&P 500, Nasdaq 100, Dow Jones, Mini Russell 2000, 30-Year US Bond, 10-Year US Note

Contract (Dec. 2011) Mini S&P 500 Mini Nasdaq 100 Dow Jones Mini Russell 2000 30-Year US Bond 10-Year US Note
Resistance Level 3——————————————

Resistance Level 2

——————————————

Resistance Level 1

——————————————

Support Level 1

——————————————

Support Level 2

——————————————

Support Level 3

1329.75 

1319.25


1317


1309.25


1304.25


1296

2501 

2490


2478


2465


2459


2447

12786 

12720


12679


12603


12555


12476

808.80 

801.70


799


793.5


790.1


784.6

14611 

14513


14426


14400


14313


14211

13228.5 

13216.5


13207(all time high)

13120


13109.5


13100.5

Continue reading “Tuesday Morning Support and Resistance”

FRIDAY Morning Support and Resistance Levels

Here’s a morning cup o’ joe for all you futures traders, our morning support and resistance levels. Good trading!

divider black 190

Support and Resistance Levels – S&P 500, Nasdaq 100, Dow Jones, Mini Russell 2000, 30-Year US Bond, 10-Year US Note

Contract (Dec. 2011) Mini S&P 500 Mini Nasdaq 100 Dow Jones Mini Russell 2000 30-Year US Bond 10-Year US Note
Resistance Level 3——————————————

Resistance Level 2

——————————————

Resistance Level 1

——————————————

Support Level 1

——————————————

Support Level 2

——————————————

Support Level 3

1293.75

1301.75


1310.5


1328.25


1347.75


1354.5

2385

2405


2428


2469


2478.5


2490

12493

12558


12631


12768


12804


12873

765.5

773.2


781.9


798.3


801.70


808.80

13920

14025


14123


14219


14226


14319

13013

13025


13031.5


13112.5


13117.5


13123.5

Continue reading “FRIDAY Morning Support and Resistance Levels”

Few pointers for you day-traders out there | Support and Resistance Levels

Jump to a section in this post:
1. Market Commentary
2. Support and Resistance Levels – S&P, Nasdaq, Dow Jones, Russell 2000
3. Support and Resistance Levels – Gold, Euro, Crude Oil, T-Bonds
4. Support and Resistance Levels – March Corn, March Wheat, Jan Beans, March Silver
5.Economic Report for January 27, 2012

1. Market Commentary

Few pointers for you day-traders out there. I am sure you have heard some from different resources but never hurts to read and absorb this again:

1. Be patient
2. Limit the number of hours you trade
3. Know your DAILY risk before the day begins and this will dictate
the number of contracts you trade
4. Choose markets with high liquidity
5. Know what reports come out every day and their impact on the markets.
6. Understand that even the best methods will have losing days.
7. Learn to accept loses
8. use RISK CAPITAL only
9. Don’t try to trade and do other things….
10. Educate yourself
11. Keep a trading journal

More to come in a webinar over the next few weeks. Will keep you posted.

2. Support and Resistance Levels – S&P, Nasdaq, Dow Jones, Russell 2000

Contract (Dec. 2011) SP500
(big & Mini)
Nasdaq100
(big & Mini)
Dow Jones
(big & Mini)
Mini Russell
Resistance Level 3 1346.17 2510.67 12895 809.77
Resistance Level 2 1337.83 2494.33 12837 804.23
Resistance Level 1 1326.17 2474.17 12759 798.17
Pivot Point 1317.83 2457.83 12701 792.63
Support Level 1 1306.17 2437.67 12623 786.57
Support Level 2 1297.83 2421.33 12565 781.03
Support Level 3 1286.17 2401.17 12487 774.97

Continue reading “Few pointers for you day-traders out there | Support and Resistance Levels”

Monday Morning Support and Resistance

Here’s a morning cup o’ joe for all you futures traders, our morning support and resistance levels. Good trading!

divider black 190

Support and Resistance Levels – S&P 500, Nasdaq 100, Dow Jones, Mini Russell 2000, 30-Year US Bond, 10-Year US Note

Contract (Dec. 2011) Mini S&P 500 Mini Nasdaq 100 Dow Jones Mini Russell 2000 30-Year US Bond 10-Year US Note
Resistance Level 3——————————————

Resistance Level 2

——————————————

Resistance Level 1

——————————————

Support Level 1

——————————————

Support Level 2

——————————————

Support Level 3

1328.5 

1321.25


1313


1300.5


1293.25


1287

2490 

2442.5


2436


2407.5


2389


2372.5

12873 

12749


12692


12573


12113


12455

808.80 

790


784.9


771.8


764.9


758.8

14307 

14222


14204


14025


13927


13920

13101 

13019


13011.5


12928.5


12925


12921

Continue reading “Monday Morning Support and Resistance”

Weekly Newsletter and Support and Resistance Levels

Jump to a section in this post:
1. Market Commentary
2. Support and Resistance Levels – S&P, Nasdaq, Dow Jones, Russell 2000
3. Support and Resistance Levels – Gold, Euro, Crude Oil, T-Bonds
4. Support and Resistance Levels – March Corn, March Wheat, Jan Beans, March Silver
5.Economic Report for January 23, 2012

1. Market Commentary

Wishing all of you a great weekend and a good trading week to come.

Weekly newsletter for your review here:

https://www.cannontrading.com/news/price-map-march-british-pound-stock-market-not-physics

2. Support and Resistance Levels – S&P, Nasdaq, Dow Jones, Russell 2000

<

Contract (Dec. 2011) SP500
(big & Mini)
Nasdaq100
(big & Mini)
Dow Jones
(big & Mini)
Mini Russell
Resistance Level 3 1320.23 2449.83 12792 792.63
Resistance Level 2 1315.87 2443.17 12728 788.57
Resistance Level 1 1313.43 2439.33 12697 785.03
Pivot Point 1309.07 2432.67 12633 780.97
Support Level 1 1306.63 2428.83 12602 777.43
Support Level 2 1302.27 2422.17 12538 773.37
Support Level 3 1299.83 2418.33 12507 769.83

Continue reading “Weekly Newsletter and Support and Resistance Levels”

10,000 Volume Chart | Support and Resistance Levels

Jump to a section in this post:
1. Market Commentary
2. Support and Resistance Levels – S&P, Nasdaq, Dow Jones, Russell 2000
3. Support and Resistance Levels – Gold, Euro, Crude Oil, T-Bonds
4. Support and Resistance Levels – March Corn, March Wheat, Jan Beans, March Silver
5.Economic Report for January 20, 2012

1. Market Commentary

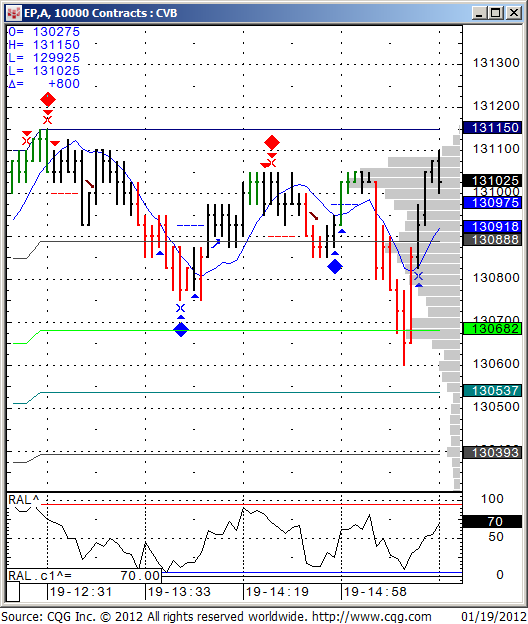
Below is an intraday chart using some of the studies I have programmed and like to apply to my charts.

As one can visually see, the last two hours of trading on the ES today worked well with my diamond algo. The chart below is 10,000 volume chart. To read why I sometimes prefer using volume charts over time charts ( example 5 minutes chart, 10 minutes etc.) and how you can get a free trial and apply my studies/ ALGO on your own charts, continue reading….
521 Continue reading “10,000 Volume Chart | Support and Resistance Levels”

Thursday Morning Support and Resistance

Here’s a morning cup o’ joe for all you futures traders, our morning support and resistance levels. Good trading!

divider black 190

Support and Resistance Levels – S&P 500, Nasdaq 100, Dow Jones, Mini Russell 2000, 30-Year US Bond, 10-Year US Note

Contract (Dec. 2011) Mini S&P 500 Mini Nasdaq 100 Dow Jones Mini Russell 2000 30-Year US Bond 10-Year US Note
Resistance Level 3——————————————

Resistance Level 2

——————————————

Resistance Level 1

——————————————

Support Level 1

——————————————

Support Level 2

——————————————

Support Level 3

1322 

1313.00


1309.75


1297


1290.5


1284.5

2490 

2478.5


2436


2402


2384


2369

12749 

12600


12577


12477


12431


12391

808.80 

895.20


781.6


768.5


762.2


756.6

14413 

14405


14328


14312


14228


14201

13111 

13108


13104.5


13025


13017.5


13003

Continue reading “Thursday Morning Support and Resistance”