____________________________________________________________________
Voted #1 Blog and #1 Brokerage Services on TraderPlanet for 2016!!
____________________________________________________________________
Dear Traders,
Trading 101: Parabolic SAR Study
- … the parabolic SAR is a trend following indicator.
- … it can be used to determine a trend and for a trailing stop.
- … the SAR works in a trending market, not in a ranging market.
- … combine the SAR with indicators designed to determine the strength of a trend.
- … you can combine the SAR with the ADX to achieve higher performance.
- … the settings can be change to make the SAR more sensitive to the price movement.
- … if you change the settings, the performance should be analyzed with a trading journal to see the effects.
Below is a chart of crude oil from last few days, I highlighted the parabolic SAR to visualize the concept above.
If you have any questions, would like to schedule a one on one consultation with one of our series 3 brokers where you can discuss trading, concepts, studies, mental part of trading and much more, fill out this form.

Good Trading!
Trading Futures, Options on Futures, and retail off-exchange foreign currency transactions involves substantial risk of loss and is not suitable for all investors. You should carefully consider whether trading is suitable for you in light of your circumstances, knowledge, and financial resources. You may lose all or more of your initial investment. Opinions, market data, and recommendations are subject to change at any time.
Futures Trading Levels
11-07-2017
| Contract December 2017 | SP500 | Nasdaq100 | Dow Jones | Mini Russell | BitCoin Index |
| Resistance 3 | 2607.50 | 6379.50 | 23621 | 1516.70 | 8144.99 |
| Resistance 2 | 2598.75 | 6348.50 | 23564 | 1510.00 | 7873.06 |
| Resistance 1 | 2593.00 | 6330.00 | 23521 | 1502.90 | 7493.11 |
| Pivot | 2584.25 | 6299.00 | 23464 | 1496.20 | 7221.18 |
| Support 1 | 2578.50 | 6280.50 | 23421 | 1489.10 | 6841.23 |
| Support 2 | 2569.75 | 6249.50 | 23364 | 1482.40 | 6569.30 |
| Support 3 | 2564.00 | 6231.00 | 23321 | 1475.30 | 6189.35 |
| Contract | December Gold | Dec. Silver | Dec. Crude Oil | Dec. Bonds | Dec. Euro |
| Resistance 3 | 1306.0 | 17.89 | 60.03 | 154 29/32 | 1.1699 |
| Resistance 2 | 1294.9 | 17.58 | 58.82 | 154 20/32 | 1.1674 |
| Resistance 1 | 1288.5 | 17.42 | 58.08 | 154 14/32 | 1.1655 |
| Pivot | 1277.4 | 17.11 | 56.87 | 154 5/32 | 1.1630 |
| Support 1 | 1271.0 | 16.94 | 56.13 | 153 31/32 | 1.1611 |
| Support 2 | 1259.9 | 16.63 | 54.92 | 153 22/32 | 1.1586 |
| Support 3 | 1253.5 | 16.47 | 54.18 | 153 16/32 | 1.1567 |
| Contract | Dec. Corn | Dec. Wheat | January Beans | Dec. SoyMeal | Dec. Nat Gas |
| Resistance 3 | 352.1 | 436.3 | 1005.58 | 320.47 | 3.25 |
| Resistance 2 | 351.2 | 433.8 | 1000.67 | 318.63 | 3.20 |
| Resistance 1 | 349.6 | 432.3 | 997.33 | 317.37 | 3.16 |
| Pivot | 348.7 | 429.8 | 992.42 | 315.53 | 3.10 |
| Support 1 | 347.1 | 428.3 | 989.1 | 314.3 | 3.1 |
| Support 2 | 346.2 | 425.8 | 984.17 | 312.43 | 3.01 |
| Support 3 | 344.6 | 424.3 | 980.83 | 311.17 | 2.97 |
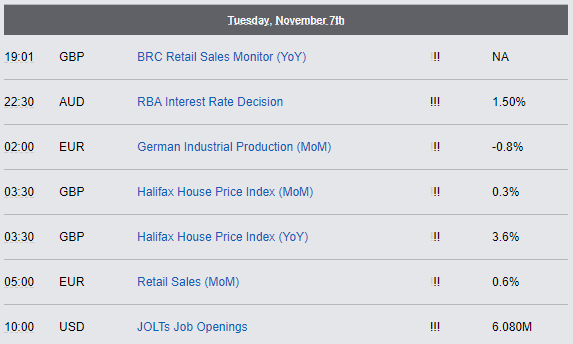
Economic Reports, source:

This is not a solicitation of any order to buy or sell, but a current market view provided by Cannon Trading Inc. Any statement of facts here in contained are derived from sources believed to be reliable, but are not guaranteed as to accuracy, nor they purport to be complete. No responsibility is assumed with respect to any such statement or with respect to any expression of opinion herein contained. Readers are urged to exercise their own judgement in trading.