Cannon Futures Weekly Letter Issue # 1214
In this issue:
- Important Notices – Earnings & NFP, Consumer Confidence
- Futures 102 – Recognizing Chart Patterns
- Hot Market of the Week – December Bean Oil
- Broker’s Trading System of the Week – Crude Oil Swing Trading System
- Trading Levels for Next Week
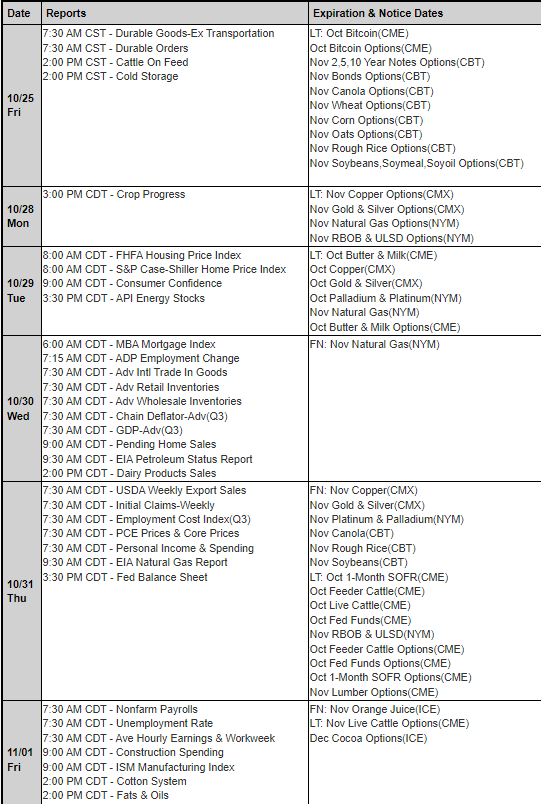
- Trading Reports for Next Week
Important Notices – Next Week Highlights:
The Week Ahead
By Mark O’Brien, Senior Broker
We’re a week away from the Labor Dept.’s release of its monthly Non-farm payrolls report. It’s widely considered to be one of the most important and influential measures of the U.S. economy. The report is released at 7:30 A.M., Central Time on the first Friday of the month.
U.S. Election Day (Nov. 5th) countdown: 11 days
Next week’s earnings include some of the largest U.S. companies by market cap.:
Apple, Microsoft, Alphabet (Google), Amazon, Meta (old Facebook), Berkshire Hathaway, Visa, Exxon Mobile, Chevron, Merck, McDonalds, Caterpillar, Uber
Apple and Microsoft each boast a market cap. of over $3 trillion. That’s 3,000,000,000,000. Google and Amazon come in at about $2 trillion.
Tuesday, Oct. 29th:
9:00: Consumer Confidence
Wednesday, Oct 30th:
7:30: Gross Domestic Product (3rd qtr.)
ADP Employment
Thursday, Oct. 31st:
7:30: Personal Income / Spending
7:30: Personal Consumption & Expenditures – Index & year-over-year
8:45: Chicago Purchasing Managers Index
Friday, Nov. 1st:
Non-Farm Payrolls / U.S. Unemployment Report
|
Before Your next Trade, learn to recognize charts and patterns!
Learning the different types of charts and patterns will be another arsenal in your Trading Tools!
- What is an Ascending Triangle Futures Chart Pattern?
What is an Ascending Triangle Futures Chart Pattern?
An ascending triangle is a bullish futures pattern that can indicate a breakout in the upwards direction.
How do I Recognize an Ascending Triangle Futures Chart Pattern?
An ascending triangle is formed when resistance remains flat and support rises.
What Does a Ascending Triangle Chart Pattern Mean?
The price will rise and fall within the triangle until support and resistance converge. At that point, the apex, breakout occurs, usually upwards.
- What is a Broadening Top Futures Chart Pattern?
- Head & Shoulders?
- Bull Flags?
- Bear Flags?
- Rectangle Bottoms?
- Rectangle Tops?
- See ACTUAL Charts Patterns images AND many more patterns you should know as a trader!
-
- Hot Market of the Week – December Hogs
Hot market of the week is provided by QT Market Center, A Swiss army knife charting package that’s not just for Hedgers, Cooperatives and Farmers alike but also for Spread traders, Swing traders and shorter time frame application for intraday traders with a unique proprietary indicator that can be applied to your specific trading needs.
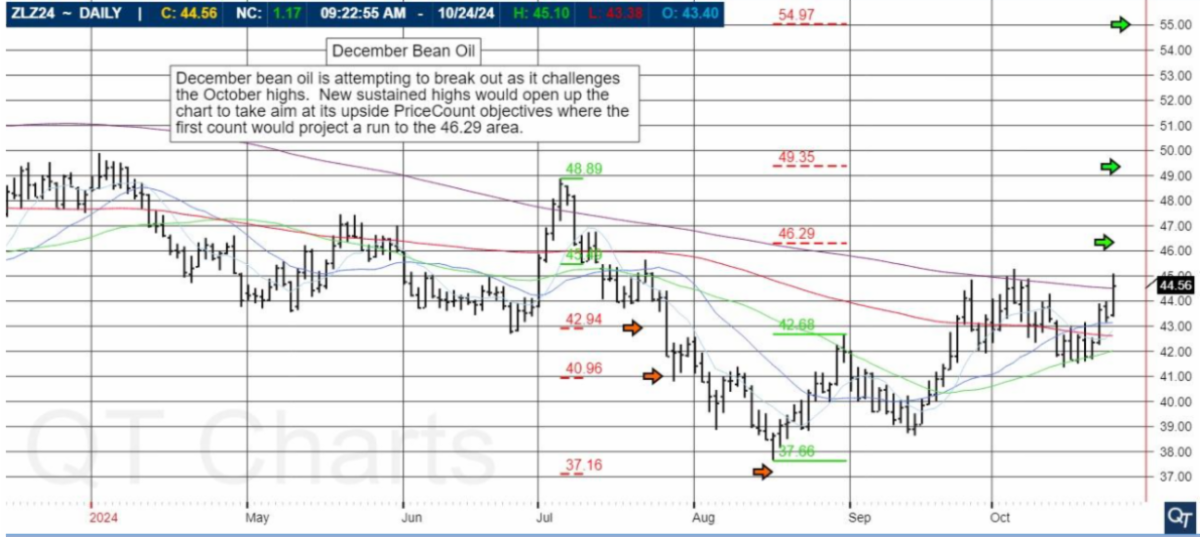
December Bean Oil
December bean oil is attempting to break out as it challenges the October highs. New sustained highs would open up the chart to take aim at its upside PriceCount objectives where the first count would project a run to the 46.29 area.
PriceCounts – Not about where we’ve been , but where we might be going next!
Broker’s Trading System of the Week
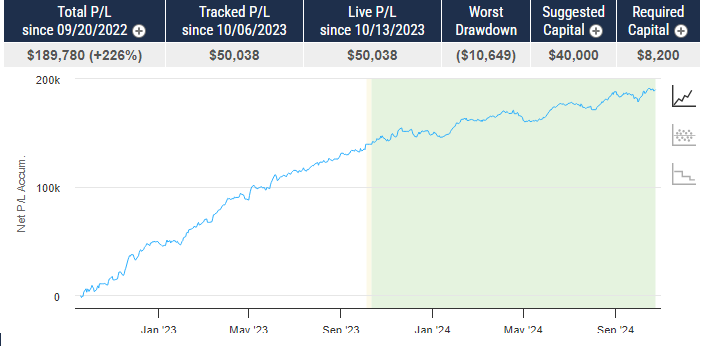
With algorithmic trading systems becoming more prevalent in portfolio diversification, the following system has been selected as the broker’s choice for this month.
Position Trading Cont v.22 _ CRUDE
PRODUCT
CL – Crude Oil
SYSTEM TYPE
Swing Trading
Recommended Cannon Trading Starting Capital
$25,000
COST
USD 165 / monthly
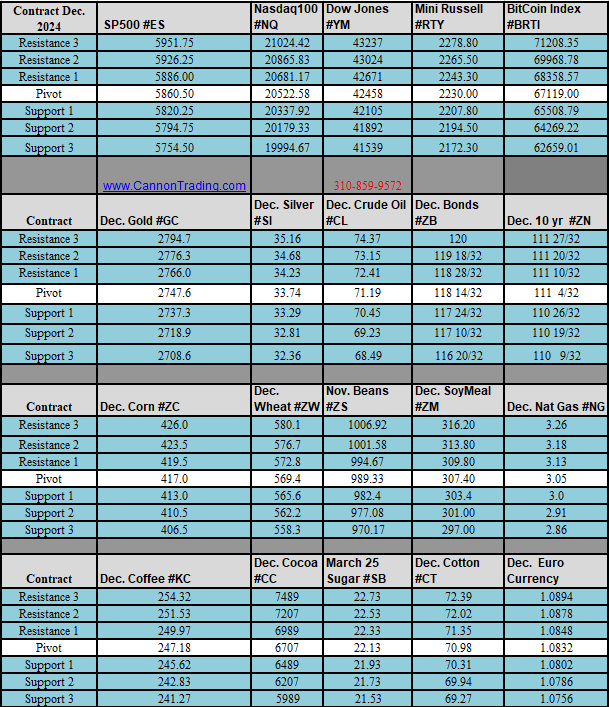
Daily Levels for October 28th, 2024
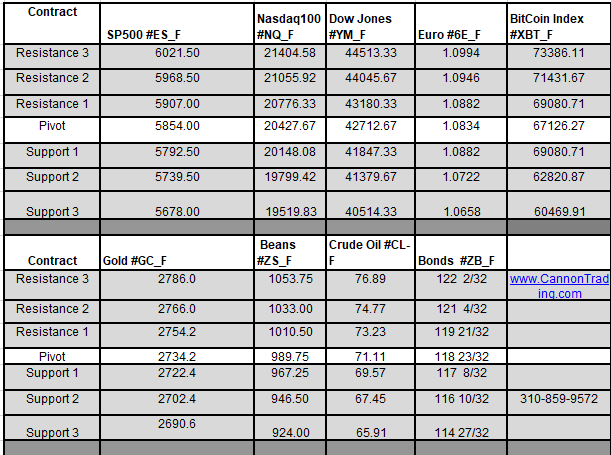
Weekly Levels for the week of October 28th, 2024

Improve Your Trading Skills
Get access to proprietary indicators and trading methods, consult with an experienced broker at 1-800-454-9572.
Explore trading methods. Register Here
* This is not a solicitation of any order to buy or sell, but a current market view provided by Cannon Trading Inc. Any statement of facts here in contained are derived from sources believed to be reliable, but are not guaranteed as to accuracy, nor they purport to be complete. No responsibility is assumed with respect to any such statement or with respect to any expression of opinion herein contained. Readers are urged to exercise their own judgement in trading.


