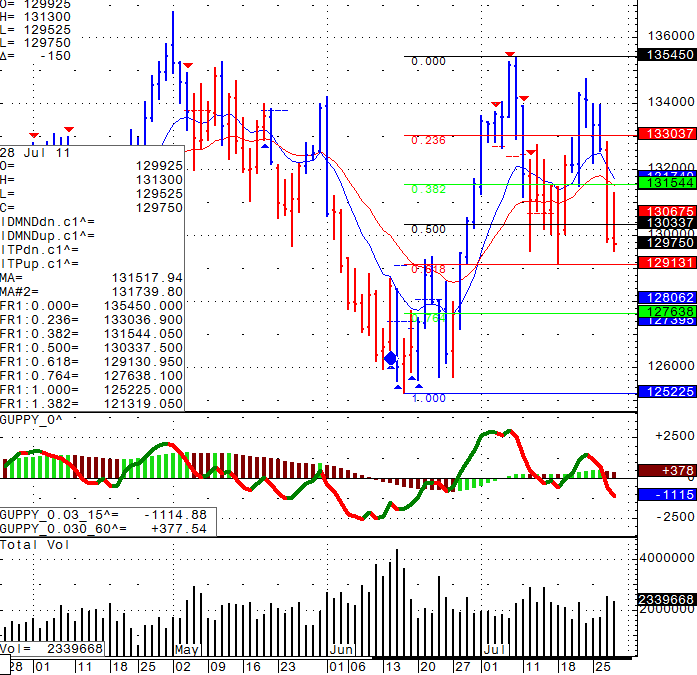
Daily chart of the mini Sp 500 for your review below along with levels to watch, volatility is INCREASING and one should always be ready for the unexpected with the US “debt battle” taking place. 1291.25 will be a key are to watch.
Daily Chart of the Mini S&P 500 from July 28th 2011

GOOD TRADING!
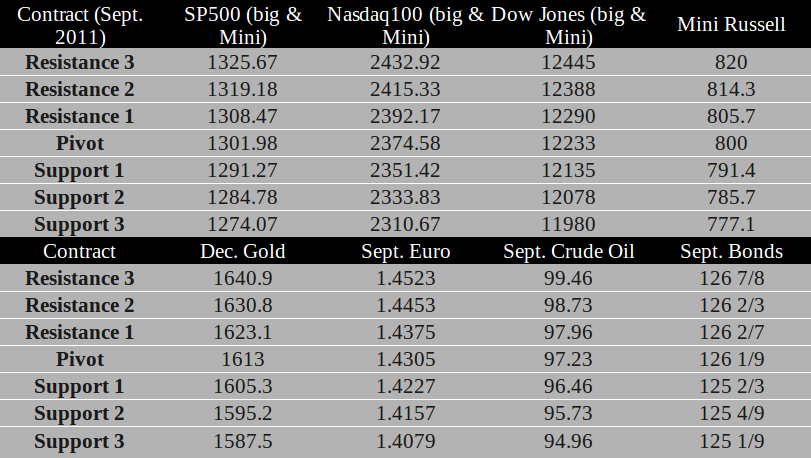
TRADING LEVELS!

Economic Reports Friday July 29th, 2011
Advance GDP q/q
8:30am USD
Advance GDP Price Index q/q
8:30am USD
Employment Cost Index q/q
8:30am USD
Chicago PMI
9:45am USD
Revised UoM Consumer Sentiment
9:55am USD
Revised UoM Inflation Expectations
9:55am USD
Economics Report Source: http://www.forexfactory.com/calendar.php

This is not a solicitation of any order to buy or sell, but a current market view provided by Cannon Trading Inc. Any statement of facts herein contained are derived from sources believed to be reliable, but are not guaranteed as to accuracy, nor they purport to be complete. No responsibility is assumed with respect to any such statement or with respect to any expression of opinion herein contained. Readers are urged to exercise their own judgment in trading!