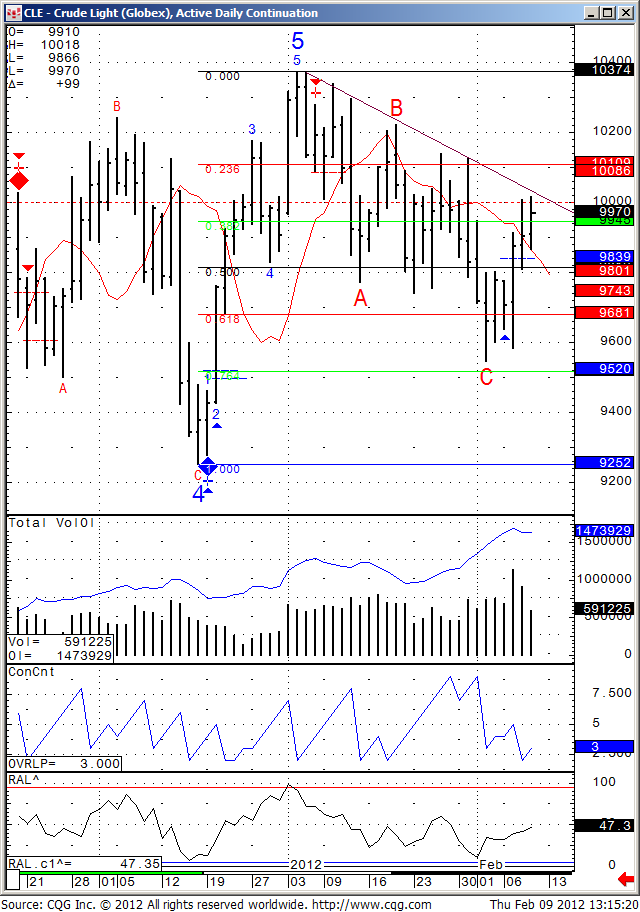
Thursday Morning Support and Resistance Numbers

Here’s a morning cup o’ joe for all you futures traders, our morning support and resistance levels. Good trading!

divider black 190

Support and Resistance Levels – S&P 500, Nasdaq 100, Dow Jones, Mini Russell 2000, 30-Year US Bond, 10-Year US Note

Contract (Mar. 2012) Mini S&P 500 Mini Nasdaq 100 Dow Jones Mini Russell 2000 30-Year US Bond 10-Year US Note
Resistance Level 3 ——————————————Resistance Level 2——————————————

Resistance Level 1

——————————————

Support Level 1

——————————————

Support Level 2

——————————————

Support Level 3

1363.751354.5


1353


1338.5


1331


1324.5

2562.52548.5


2539


2522


2505


2476

1300012907


12894


12789


12734


12635

860.00843.4


832


820.2


814.9


802.70

1431414231


14214


14123


14113


14021

1311713111


13104


13025


13023


13015.5

Continue reading “Thursday Morning Support and Resistance Numbers”

Daily Chart of the Mini SP 500 | Support and Resistance Levels

Jump to a section in this post:
1. Market Commentary
2. Support and Resistance Levels – S&P, Nasdaq, Dow Jones, Russell 2000
3. Support and Resistance Levels – Gold, Euro, Crude Oil, T-Bonds
4. Support and Resistance Levels – March Corn, March Wheat, Jan Beans, March Silver
5. Economic Reports for Thursday, January 4, 2012

divider black 190

1. Market Commentary

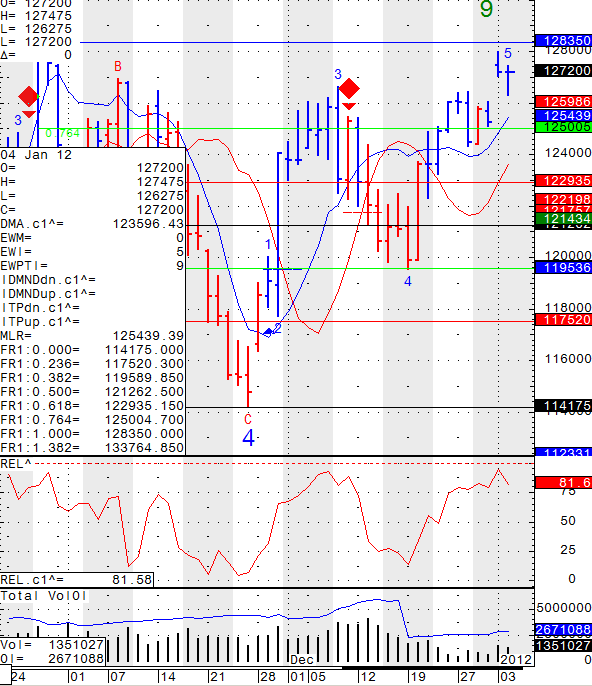
The New year started but seems that some trades are still away from the markets as volume is still considerably lower than average. Today’s trading in mini SP is a good example, choppy trade, less than 1.4 Mil contracts and market end up pretty much unchanged….

I am including a daily chart of the mini SP 500 for your review. I suspect that more volume and volatility will return to the markets in the next few days.

514 Continue reading “Daily Chart of the Mini SP 500 | Support and Resistance Levels”

Top Five Commodities to Watch | Canadian Dollar Chart | Support and Resistance Levels

Jump to a section in this post:
1. Market Commentary
2. Support and Resistance Levels – S&P, Nasdaq, Dow Jones, Russell 2000
3. Support and Resistance Levels – Gold, Euro, Crude Oil, T-Bonds
4. Economic Reports for Monday, November 14 2011

divider black 190

1. Market Commentary

This week’s “Top 5 Commodities to Watch”, an article written by Cannon Trading’s senior broker John D. Thorpe, was featured on the Financial Edge section of Investopedia. John introduces Gold, Live Cattle, Corn, Sugar, and energies like Crude Oil, Unleaded Gas and Heating Oil as the commodities to watch over the next month. He then breaks down why investors should be paying attention, citing a variety of international price pressures, seasonal tendencies, and recent government data.

divider black 190

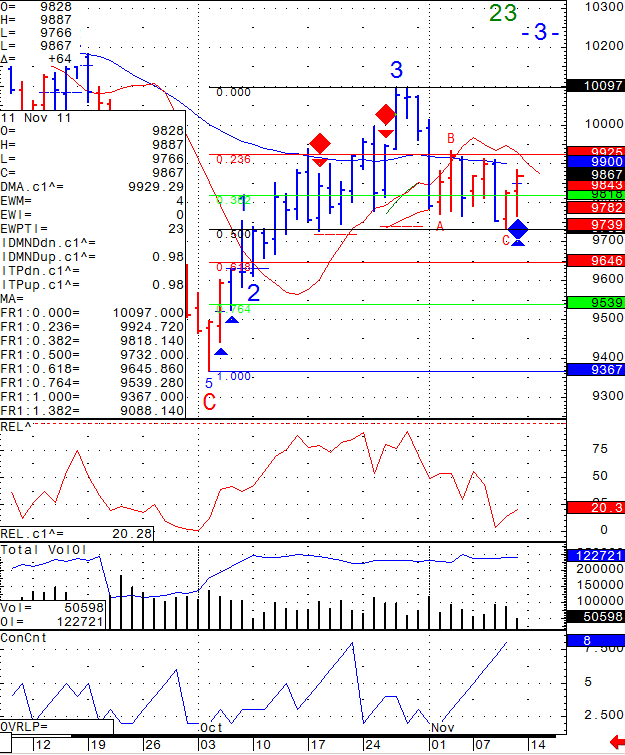
Also below is a daily chart of Canadian Dollar along with the trade reco I sent subscribers yesterday:

Long Dec. Canada

Long at 98.03 limit

stop 97.20

target 99.18

canadian dollar

If you would like to be included on Swing Trade Alerts such as this one,

please send me an email with the following information:

1. Are you currently trading futures?
2. Charting software you use?
3. If you use sierra or ATcharts, please let me know the user name so I can enable you
4. Markets you currently trading?

divider black 190

2. Support and Resistance Levels – S&P, Nasdaq, Dow Jones, Russell 2000

Contract (Dec. 2011) SP500
(big & Mini)
Nasdaq100
(big & Mini)
Dow Jones
(big & Mini)
Mini Russell
Resistance Level 3 1278.53 2435.00 12303 775.70
Resistance Level 2 1271.52 2397.50 12217 759.90
Resistance Level 1 1266.63 2375.00 12163 751.30
Pivot Point 1259.62 2337.50 12077 735.50
Support Level 1 1254.73 2315.00 12023 726.90
Support Level 2 1247.72 2277.50 11937 711.10
Support Level 3 1242.83 2255.00 11883 702.50


3. Support & Resistance Levels for Gold, Euro, Crude Oil, and U.S. T-Bonds

Contract Dec. Gold Dec. Euro Nov. Crude Oil Dec. Bonds
Resistance Level 3 1823.9 1.4056 101.54 142 1/32
Resistance Level 2 1806.6 1.3926 100.37 141 21/32
Resistance Level 1 1798.0 1.3839 99.69 141 4/32
Pivot Point 1780.7 1.3709 98.52 140 24/32
Support Level 1 1772.1 1.3622 97.84 140 7/32
Support Level 2 1754.8 1.3492 96.67 139 27/32
Support Level 3 1746.2 1.3405 95.99 139 10/32

divider black 190

4. Economic Reports for Monday, November 14, 2011

Industrial Production m/m
5:00am

Mortgage Delinquencies
14th – 18th

Commodities Market Volatility Continues | Support and Resistance Levels

In this post:

1. Market Commentary
2. Support and Resistance Levels
3. Daily Mini Mini S&P 500 Futures Chart

divider black 190

1. Market Commentary

Volatility remains high and what I wrote the last few days, still holds:

As far as the daily chart, I am now confused again….I got tempted on the short side and got burnt very quickly today….Once again there is a CASE for both sides, bulls and the bears and the potential for a BIG MOVE EITHER WAY is greater than normal as we are sitting on important price levels in the SP500, which has been the leader for the rest of the markets as of the last few weeks. Continue reading “Commodities Market Volatility Continues | Support and Resistance Levels”

Futures Trading Levels, Crude Oil as a Leader of Commodity Prices

Cannon Trading / E-Futures.com

Crude Oil has been moving the rest of the commodities sector the last few months and has influence on all futures.

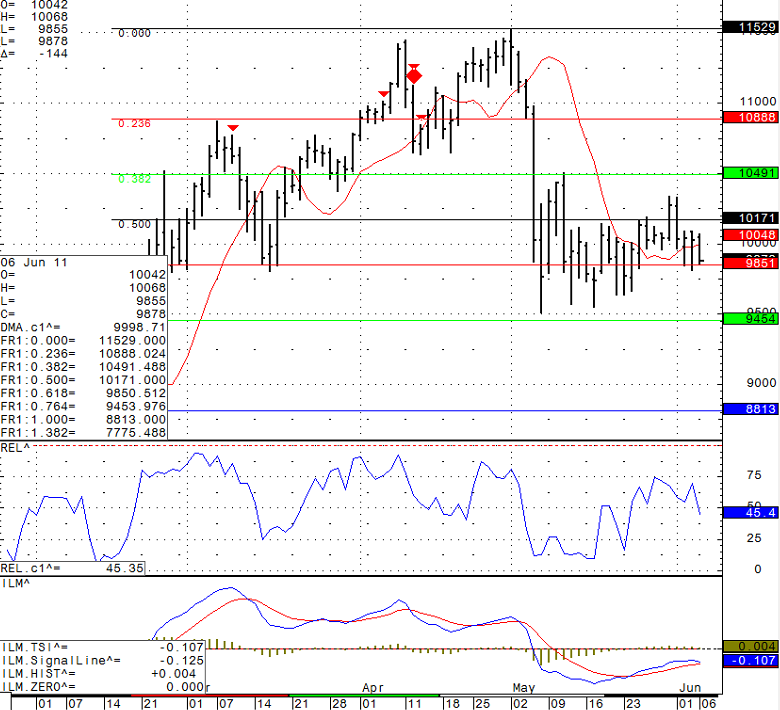
Thought I would share a daily chart for review, along with a screen shot of the crude oil set ups I share in my daily live day-trade signals service.

As far as longer term direction for crude, I will need to see which level we can break out first, 104.91 on the upside or 94.54 on the downside. In between, you have wide 410 trading range ( equal to $10,000 per one contract against you or in your favor….)

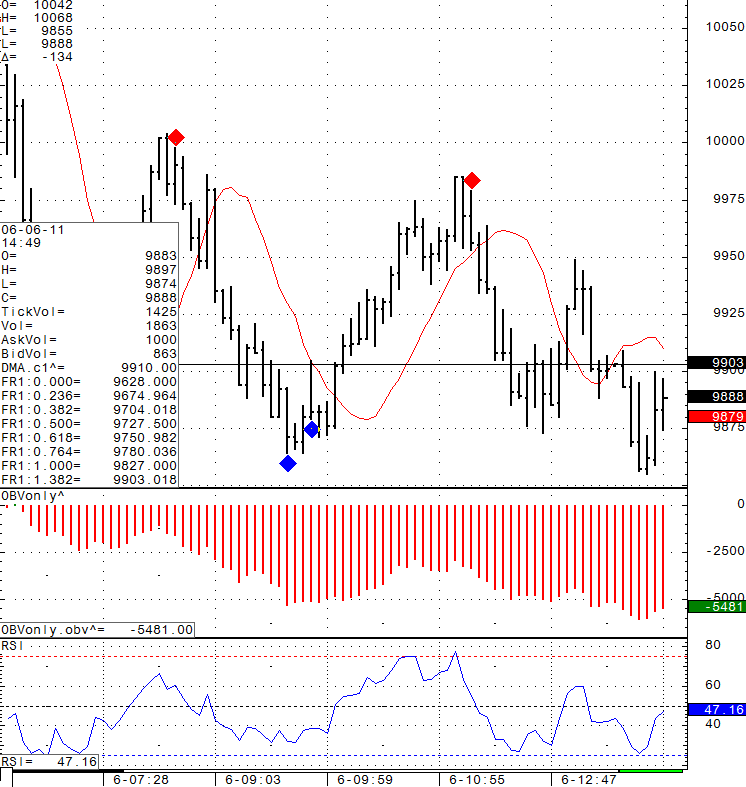
Daily mini S&P trading chart screenshot from today June 6th, 2011

Stock futures trading chart levels for Monday June 6th, 2011

Intra-day trading chart screenshot from today June 6th, 2011

Intra-day chart: (blue diamond = potential buy, red diamond = potential sell)

Stock futures trading chart levels for Monday June 6th, 2011 Continue reading “Futures Trading Levels, Crude Oil as a Leader of Commodity Prices”

Futures Trading Levels, Crude Oil Leading Commodity Markets

Cannon Trading / E-Futures.com

With the Mid East situation, Crude Oil has been the leader of the commodities markets affecting movements in markets like metals, stock indices and more.

Daily chart of Crude oil for your review below along with a small picture that expresses what one can expect of tomorrow’s unemployment report better than I can…..
Either way, higher volatility, wider ranges = trader must asses their daily risk settings, their stops/ targets per trade, trading size etc.

Daily E-Mini S&P 500 Futures Trading Chart

Stock futures trading chart levels Friday March 4th 2011
Continue reading “Futures Trading Levels, Crude Oil Leading Commodity Markets”

Commodities Margins Rising to Cool Markets, November 22nd 2010

Have a great weekend and a good, short trading week ahead of Thanksgiving holiday.

Good quick article for your reading pleasure:
*****************************************************
http://www.cnbc.com/id/40274878
*****************************************************

Commodities Margins Rising to Cool Markets Continue reading “Commodities Margins Rising to Cool Markets, November 22nd 2010”

Free Day Trading Webinar Trial, October 18th 2010

Have a great weekend!! take time to clear your “trading brain” and allow it to recharge.

Screen shot from today’s session during our “live charts” service where one can see real-time trade set ups like below
(blue diamonds = possible buy, red diamonds = possible sell)

Charts included in this service are: Mini SP 500, Euro Currency and Crude oil.

For a Free Day Trading Webinar Trial Please Visit:
**************************************************************
https://www.cannontrading.com/tools/intraday-futures-trading-signals
**************************************************************

Continue reading “Free Day Trading Webinar Trial, October 18th 2010”