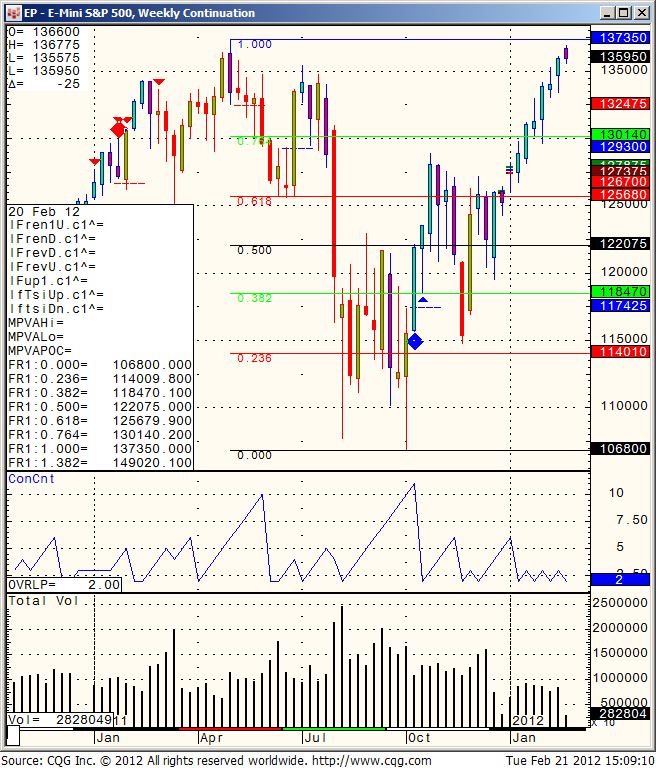
WEEKLY chart of Mini SP 500 | Support and Resistance Levels
Posted By:- Ilan Levy-Mayer Vice President, Cannon Trading Futures Blog
Jump to a section in this post:
1. Market Commentary
2. Support and Resistance Levels – S&P, Nasdaq, Dow Jones, Russell 2000
3. Support and Resistance Levels – Gold, Euro, Crude Oil, T-Bonds
4. Support and Resistance Levels – March Corn, March Wheat, Jan Beans, March Silver
5.Economic Report for February 22, 2012
1. Market Commentary
Hello Traders,
We came back fro President’s Day long weekend to find crude up over $2.00.
Gold followed on the same uncertainties and finished up $35
Our stock market on the other hand, finished unchanged on another less than avg. volume.
WEEKLY chart of mini SP 500 for your review below. We are trading against the high from last May and it will be interesting to see what type of price action and volume we will see here.

2. Support and Resistance Levels – S&P, Nasdaq, Dow Jones, Russell 2000
| Contract (Dec. 2011) | SP500 (big & Mini) |
Nasdaq100 (big & Mini) |
Dow Jones (big & Mini) |
Mini Russell |
| Resistance Level 3 | 1374.50 | 2592.33 | 13053 | 845.00 |
| Resistance Level 2 | 1370.00 | 2597.67 | 13017 | 838.80 |
| Resistance Level 1 | 1365.00 | 2564.33 | 12978 | 830.40 |
| Pivot Point | 1360.50 | 2569.67 | 12942 | 824.20 |
| Support Level 1 | 1355.50 | 2536.33 | 12903 | 815.80 |
| Support Level 2 | 1351.00 | 2541.67 | 12867 | 809.60 |
| Support Level 3 | 1346.00 | 2508.33 | 12828 | 801.20 |
3. Support & Resistance Levels for Gold, Euro, Crude Oil, and U.S. T-Bonds
| Contract | April. Gold | March Euro | Feb. Crude Oil | March. Bonds |
| Resistance Level 3 | 1800.5 | 1.3404 | 108.72 | 142 30/32 |
| Resistance Level 2 | 1781.1 | 1.3350 | 107.60 | 142 14/32 |
| Resistance Level 1 | 1771.0 | 1.3296 | 106.85 | 141 30/32 |
| Pivot Point | 1751.6 | 1.3242 | 105.73 | 141 14/32 |
| Support Level 1 | 1741.5 | 1.3188 | 104.98 | 140 30/32 |
| Support Level 2 | 1722.1 | 1.3134 | 103.86 | 140 14/32 |
| Support Level 3 | 1712.0 | 1.3080 | 103.11 | 139 30/32 |
4. Support & Resistance Levels for Corn, Wheat, Beans and Silver
| Contract | March Corn | March Wheat | March Beans | March. Silver |
| Resistance Level 3 | 646.9 | 649.3 | 1291.67 | 3575.2 |
| Resistance Level 2 | 641.8 | 643.7 | 1283.33 | 3510.8 |
| Resistance Level 1 | 635.7 | 638.3 | 1277.17 | 3473.7 |
| Pivot Point | 630.6 | 632.7 | 1268.83 | 3409.3 |
| Support Level 1 | 624.4 | 627.3 | 1262.7 | 3372.2 |
| Support Level 2 | 619.3 | 621.7 | 1254.33 | 3307.8 |
| Support Level 3 | 613.2 | 616.3 | 1248.17 | 3270.7 |
5. Economic Reports
3:00am EUR
French Flash Services PMI
3:30am EUR
German Flash Manufacturing PMI
3:30am EUR
German Flash Services PMI
4:00am EUR
Flash Manufacturing PMI
4:00am EUR
Flash Services PMI
5:00am EUR
Industrial New Orders m/m
9:00am EUR
Belgium NBB Business Climate
10:00am USD
Existing Home Sales


