Crude Oil Futures Testing Major Weekly Support Level, SP500 Volatility Higher + Levels for 8.6.2014

Hello Traders,

For 2014 I would like to wish all of you discipline and patience in your trading!

Volatility has picked up again! Make sure you adapt as markets are always changing and what may work for range bound/ low volatility days will not work for wide range/ higher volatility days.

I see major support for SP500 at 1795 and it will be interesting to see price reaction if we test this level in the next few days.

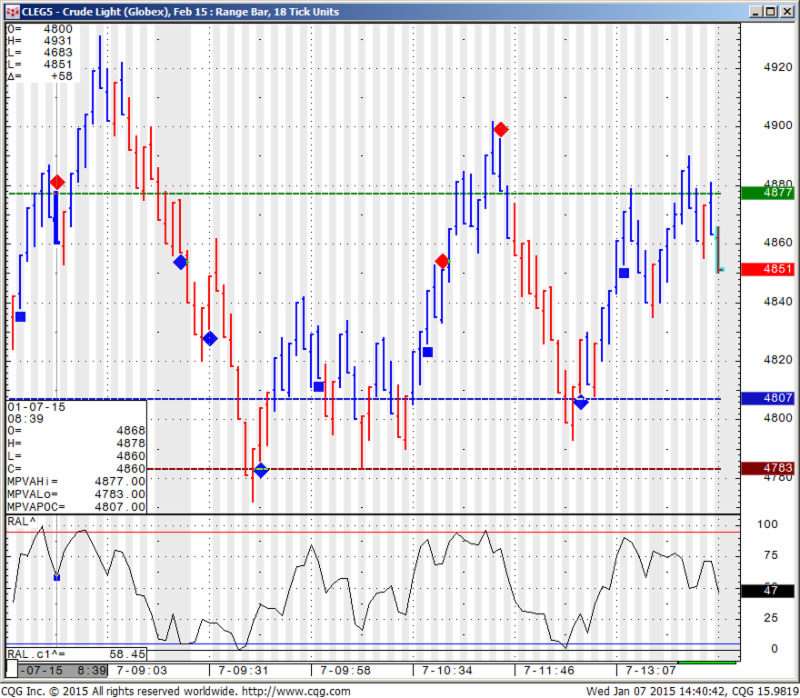
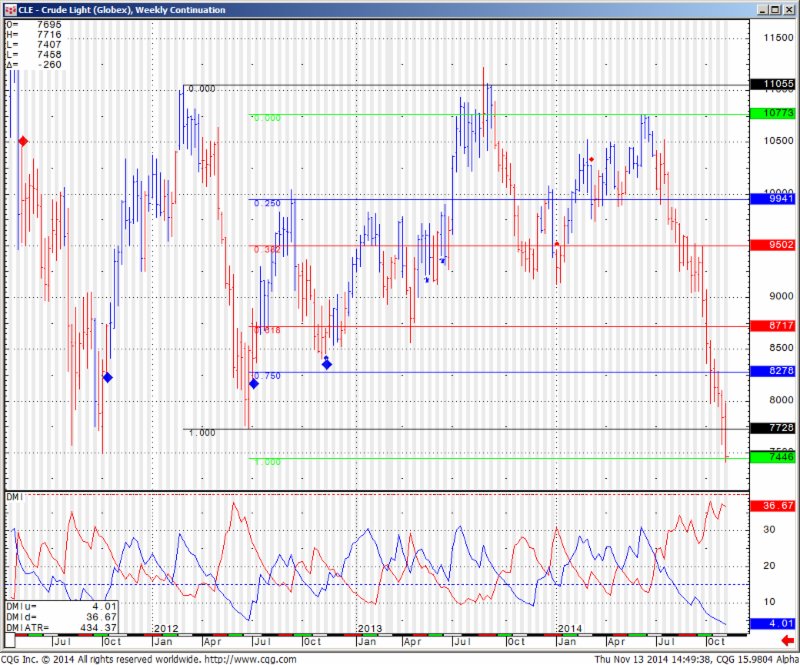
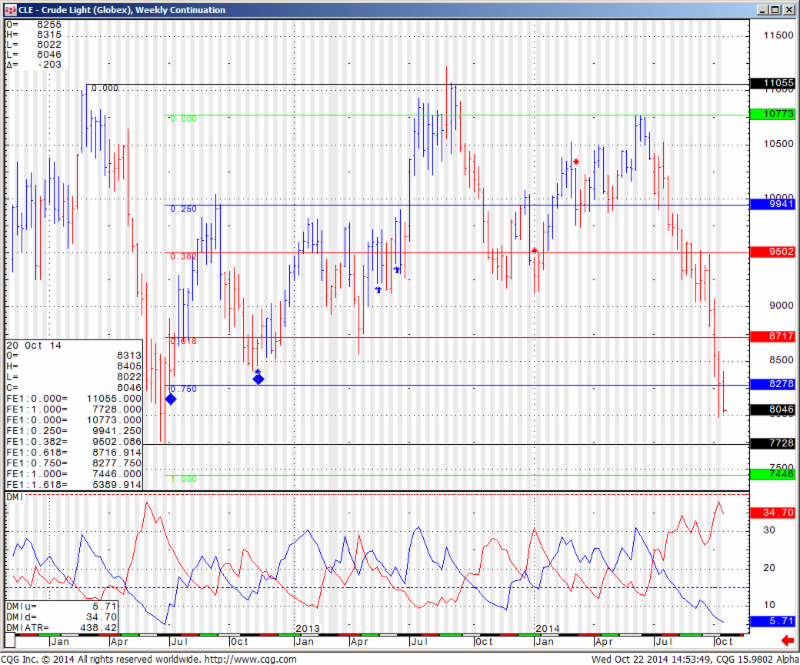
On a different note, I wrote a quick analysis along with chart for Crude Oil futures at:

http://experts.forexmagnates.com/crude-oil-attempting-break-lower/

Continue reading “Crude Oil Futures Testing Major Weekly Support Level, SP500 Volatility Higher + Levels for 8.6.2014”

Futures Levels and Economic Reports 7.24.2014

Connect with Us! Use Our Futures Trading Levels and Economic Reports RSS Feed.

Like us on FacebookFollow us on TwitterView our profile on LinkedInFind us on Google+Cannon Trading Futures Trading Resistance & Support Levels and Economic ReportsFind us on Yelp

1. Market Commentary
2. Futures Support and Resistance Levels – S&P, Nasdaq, Dow Jones, Russell 2000, Dollar Index
3. Commodities Support and Resistance Levels – Gold, Euro, Crude Oil, T-Bonds
4. Commodities Support and Resistance Levels – Corn, Wheat, Beans, Silver
5. Futures Economic Reports for Thursday July 24, 2014

Hello Traders,

For 2014 I would like to wish all of you discipline and patience in your trading!

Getting Clues from other markets?

When day trading a specific market do you only look at the chart for that specific market? Maybe you took it a step further and you are viewing multiple time frame charts for the same market which is a good step in my eyes.

Now lets take this even one step further by observing what markets have correlation, direct or inverse to the market you are trading, perhaps this can help you make decisions when trading.

I will give a few examples from my experience:

When I am in a position in the mini SP 500, I will often observe what the bonds are doing ( many times inverse correlation), I will take notice of what the Dow, Russell and NASDAQ are doing as well ( direct correlation).

If I am trading crude oil, I will many times pay attention to what unleaded gas and heating oil are doing (very close, although not direct correlation) as well as what WTI crude is doing.

One more example may be when I have a position trade in beans and I will try to get a feel for the overall direction of the grain markets (is there a trend? are they sideways?) by looking at corn, wheat in general and then look to see what bean oil and soy meal which are by products of beans are doing.

One question that can be asked is “what do you mean observe this or that market”? and a good example will be:

Lets say I am short the mini SP 500 and I am not sure if to take profit or not. I look at the mini Russell and see that mini Russell just made new lows, that will give me more confidence to stay in my short position as I feel there might be more room to the downside.

Continue reading “Futures Levels and Economic Reports 7.24.2014”

Crude Oil Futures Renko Charts & Economic Reports 7.23.2014

Connect with Us! Use Our Futures Trading Levels and Economic Reports RSS Feed.

Like us on FacebookFollow us on TwitterView our profile on LinkedInFind us on Google+Cannon Trading Futures Trading Resistance & Support Levels and Economic ReportsFind us on Yelp

1. Market Commentary
2. Futures Support and Resistance Levels – S&P, Nasdaq, Dow Jones, Russell 2000, Dollar Index
3. Commodities Support and Resistance Levels – Gold, Euro, Crude Oil, T-Bonds
4. Commodities Support and Resistance Levels – Corn, Wheat, Beans, Silver
5. Futures Economic Reports for Wednesday July 23, 2014

Hello Traders,

For 2014 I would like to wish all of you discipline and patience in your trading!

I mentioned in previous posts that I am getting to like range bar charts and Renko charts more and more when it comes for very short term trading.

The main reason why I like these type of charts along with volume charts when it comes to any time frame less than 10 minutes is because I think it helps filter out noise during slow times and help you get a quicker signal when there is time of heavier action in the market.

Example, let’s say you are using a 5 minute chart along with certain studies, to make a simple example, moving averages cross overs. Before you get a signal, the 5 minute bar has to finish so you can see the value of the moving averages and see if you got a cross over or not. There are times when the market is fast with heavy volume and you may miss 80% of the move because 5 minutes can be a long time for day traders…..On the other hand if you are using Renko/volume charts/Range bars and there is good volume, fast action, these bars will complete much faster to provide a much faster signal. On the same token, if the market is slow with low volume, you will sometimes get your moving averages cross over simply because time has passed….With volume / Renko charts you may be able to filter this out simply because the bars WONT complete unless there is enough volume/ price action. Obviously, these type of charts are by no means “holly grail” but I think one should observe and pay attention to the type of charts especially if you are a short term day trader.

Below is an example of crude oil 18 ticks range bar from today as well as a 5 minutes chart from today with the same studies/ conditions applied just to get a visual idea. If you like to try out the same charts I am sharing, feel free to contact Cannon Futures Trading and we will set you up for a free trial:

Crude Oil 5 minute chart 7-22-2014

Crude Oil 5 Minute Chart 7-22-2014

Continue reading “Crude Oil Futures Renko Charts & Economic Reports 7.23.2014”

Crude Oil & Gold Futures Information & Economic Reports 6.11.2014

Connect with Us! Use Our Futures Trading Levels and Economic Reports RSS Feed.

Like us on FacebookFollow us on TwitterView our profile on LinkedInFind us on Google+Cannon Trading Futures Trading Resistance & Support Levels and Economic ReportsFind us on Yelp

1. Market Commentary
2. Futures Support and Resistance Levels – S&P, Nasdaq, Dow Jones, Russell 2000, Dollar Index
3. Commodities Support and Resistance Levels – Gold, Euro, Crude Oil, T-Bonds
4. Commodities Support and Resistance Levels – Corn, Wheat, Beans, Silver
5. Futures Economic Reports for Wednesday June 11, 2014

Hello Traders,

For 2014 I would like to wish all of you discipline and patience in your trading!


Once again we are witnessing lower volume, lower volatility as stock indices are hanging around their all time highs….

I know that for me personally, this type of environment would be hard to day trade, hence the reason I am sharing with you a piece I wrote before about other markets to consider for day trading:

Crude Oil and Gold futures.


More than a few similarities between the two markets.

They are both volatile, can move VERY fast. I have seen some very large moves happen in matter of minutes if not seconds. The “fear & greed” factor really plays a role in these specific two markets.

Both have active trading hours starting with Far East trading around 10 PM est all the way to the next morning until about 3 PM est. Good volume generally speaking but not close to the mini SP or ten year notes. So you may see some slippage on stops but the volume is more than enough to trade size.

Each tick on gold is $10, so every dollar move =$100 against you or in your favor. Crude is similar, each tick = $10. One full $1 move = $1000.

Both markets were quiet today relatively speaking but even on a quiet day, the range on gold was $13 or = $1300 wide using one futures contract. Crude ranges today was  than $1.08 or about $1080 between hi/lo.

I like using overbought/ oversold indicators on the two markets as well as using range / Renko charts.


If you like the information we share? We would appreciate your positive reviews on our new yelp!! Continue reading “Crude Oil & Gold Futures Information & Economic Reports 6.11.2014”

Crude Oil Futures Chart & Futures/Commodities Levels 5.07.2014

Connect with Us! Use Our Futures Trading Levels and Economic Reports RSS Feed.

Like us on FacebookFollow us on TwitterView our profile on LinkedInFind us on Google+Cannon Trading Futures Trading Resistance & Support Levels and Economic ReportsFind us on Yelp

1. Market Commentary
2. Futures Support and Resistance Levels – S&P, Nasdaq, Dow Jones, Russell 2000, Dollar Index
3. Commodities Support and Resistance Levels – Gold, Euro, Crude Oil, T-Bonds
4. Commodities Support and Resistance Levels – Corn, Wheat, Beans, Silver
5. Futures Economic Reports for Wednesday May 7, 2014

Hello Traders,

For 2014 I would like to wish all of you discipline and patience in your trading!

 Below is a screen shot of the Crude Oil chart from the last few trading sessions. I use 18 ticks range bar chart. This model does well when the market has two sided volatility and action like in the chart below but tend to get chopped when there is a strong trend.


809 Continue reading “Crude Oil Futures Chart & Futures/Commodities Levels 5.07.2014”

How Crude Oil Prices Affect Gas Prices

There are a few different aspects that factor into how crude oil prices affect what consumers pay at the pump. Oil is directly affected by geopolitical events, weather patterns, distribution costs, supply, demand and State and Federal taxes, to name a few. As the aforementioned forces are unpredictable and as they become more volatile, so becomes crude oil. Understanding each factor and the role it plays with respects to the rise and fall in prices, may help someone understand how to utilize the information to make better trading decisions.

Supply

First and foremost supply is affected by various socioeconomic and political factors within and around the region of origin. Also, OPEC, an organization commenced in 12 of the top oil producing companies and producing just fewer than 50% of the world’s oil supply, regulate their portion of crude oil produced. Often OPEC will be in positions to sell or barter away the oil they produce in exchange for currency or other assets that will benefit their interests. The United States itself houses around 700 million barrels in its Strategic Petroleum Reserves for use in the event of political dissensions with oil producing nations, as well as for emergencies such as natural disaster affected regions of the country.

Demand

The driving forces behind the demand for crude oil can be a number of factors. The most obvious, of course, is the rate and amount of oil each country uses. According to the CIA World Fact book, the United States tops of the market at 21%, the EU uses 15% of the world’s oil and China consumes 11%. As countries develop, particularly within their middle class infrastructure, this creates more consumers and more consumers using vehicles, driving the demand higher. On the back end of developments like this, oil refineries must adjust production to suit the growing need, which also incurs a higher cost in that production.

Continue reading “How Crude Oil Prices Affect Gas Prices”

How Does Crude Oil Affect Gas Prices? What Else Does?

The answer to the question in the title of this piece was stated pretty assuredly in a 2005 publication by the Federal Trade Commission. The most important factor in the price of gasoline, the 166-page report concluded, was “the world price of crude oil“. It went on: “Over the last 20 years, changes in crude oil prices have explained 85% of the changes in the price for gasoline in the U.S.”1 And there aren’t too many macro-unknowns out there to affect the price of crude oil. The world produces roughly 85 million barrels of oil every day and every day the world’s population consumes about 90 million barrels. And the generally accepted relationship between crude oil and gasoline is that for every $1 dollar per barrel crude oil moves, gas prices move about 2 ½ cents at the pump. It’s also generally accepted that there’s approximately 1.5 trillion barrels of oil yet to be extracted from the planet – what are called proven reserves – equal to about 50 more years of supply based on our current consumption rate. And according to OPEC’s web site, that cartel – created over 50 years ago – controls about 80% of those reserves.

OPEC Share of World Crude Oil Reserves 2012

Account for some margin of error and those are all pretty workable numbers for a global commodity like crude oil to live with. The quandary for tracking gas prices isn’t that you can’t measure them accurately against the price of crude oil. That relationship is pretty ingrained. It’s the many other factors that also come into play – at different levels of influence and intensity and at irregular intervals – that cause gasoline prices to move.

Just take a look at the last 6 months. Crude oil shot up over 20% from $86 per barrel to almost $110 per barrel. It then fell over 10% back down to near $96 per barrel.

Continue reading “How Does Crude Oil Affect Gas Prices? What Else Does?”

Futures Trading Levels and Economic Reports for September 25, 2013

Connect with Us! Use Our Futures Trading Levels and Economic Reports RSS Feed.

Like us on FacebookFollow us on TwitterView our profile on LinkedInFind us on Google+Cannon Trading Futures Trading Resistance & Support Levels and Economic ReportsFind us on Yelp

1. Market Commentary
2. Futures Support and Resistance Levels – S&P, Nasdaq, Dow Jones, Russell 2000, Dollar Index
3. Commodities Support and Resistance Levels – Gold, Euro, Crude Oil, T-Bonds
4. Commodities Support and Resistance Levels – Corn, Wheat, Beans, Silver
5. Futures Economic Reports for Wednesday September 25, 2013

Hello Traders,

For 2013 I would like to wish all of you discipline and patience in your trading! 

Today’s two sided volatility in crude oil futures fitted my trading model/philosophy well.

Below is a screen shot from today along with the different signals.

If you like a free trial to this ALGO along with the PDF document I created, which explains the set ups ( AND have not had the trial before…) then follow instructions below the chart.

Crude Oil 18 Ticks Range Bar Charts

If you like the information we share? We would appreciate your positive reviews on our new yelp!!

GOOD TRADING

Trading Futures, Options on Futures, and retail off-exchange foreign currency transactions involves substantial risk of loss and is not suitable for all investors. You should carefully consider whether trading is suitable for you in light of your circumstances, knowledge, and financial resources. You may lose all or more of your initial investment. Opinions, market data, and recommendations are subject to change at any time.

If you like Our Futures Trading Daily Support and Resistance Levels, Please share!

Futures Trading Levels

Contract Dec. 2013  SP500 (big & Mini) Nasdaq100 (big & Mini) Dow Jones (big & Mini) Mini Russell Dollar Index
Resistance 3 1713.17 3257.25 15457 1096.87 81.02
Resistance 2 1707.08 3244.00 15413 1088.33 80.88
Resistance 1 1699.67 3229.25 15348 1080.37 80.79
Pivot 1693.58 3216.00 15304 1071.83 80.66
Support 1 1686.17 3201.25 15239 1063.87 80.57
Support 2 1680.08 3188.00 15195 1055.33 80.43
Support 3 1672.67 3173.25 15130 1047.37 80.34
Contract Dec. Gold Dec. Silver Nov. Crude Oil Dec. Bonds  Dec. Euro
Resistance 3 1356.7 2275.2 105.22 134 18/32 1.3562
Resistance 2 1343.1 2239.3 104.43 133 27/32 1.3542
Resistance 1 1332.8 2204.2 103.88 133 14/32 1.3507
Pivot 1319.2 2168.3 103.09 132 23/32 1.3487
Support 1 1308.9 2133.2 102.54 132 10/32 1.3452
Support 2 1295.3 2097.3 101.75 131 19/32 1.3432
Support 3 1285.0 2062.2 101.20 131  6/32 1.3397
Contract Dec Corn Dec. Wheat Nov.Beans Dec. SoyMeal Dec. bean Oil
Resistance 3 457.7 662.8 1325.67 424.07 42.38
Resistance 2 455.6 660.9 1322.83 420.03 42.32
Resistance 1 452.2 659.6 1317.67 416.17 42.20
Pivot 450.1 657.7 1314.83 412.13 42.14
Support 1 446.7 656.3 1309.7 408.3 42.0
Support 2 444.6 654.4 1306.83 404.23 41.96
Support 3 441.2 653.1 1301.67 400.37 41.84
For complete contract specifications for the futures markets listed above click here!

5. Economic Reports

source:http://www.forexfactory.com/calendar.php

All times are Eastern time Zone (EST)


Date 3:52pm Currency Impact Detail Actual Forecast Previous Graph
WedSep 25  2:00am EUR GfK German Consumer Climate 7.1 6.9
8:30am USD Core Durable Goods Orders m/m 1.1% -0.8%
USD Durable Goods Orders m/m 0.0% -7.4%
10:00am USD New Home Sales 422K 394K
10:30am USD Crude Oil Inventories -1.0M -4.4M

This is not a solicitation of any order to buy or sell, but a current market view provided by Cannon Trading Inc. Any statement of facts herein contained are derived from sources believed to be reliable, but are not guaranteed as to accuracy, nor they purport to be complete. No responsibility is assumed with respect to any such statement or with respect to any expression of opinion herein contained. Readers are urged to exercise their own judgment in trading

Futures Trading Levels and Economic Reports for April 25, 2013

Connect with Us! Use Our Futures Trading Levels and Economic Reports RSS Feed.

Like us on FacebookFollow us on TwitterView our profile on LinkedInFind us on Google+Cannon Trading Futures Trading Resistance & Support Levels and Economic ReportsFind us on Yelp

1. Market Commentary
2. Futures Support and Resistance Levels – S&P, Nasdaq, Dow Jones, Russell 2000, Dollar Index
3. Commodities Support and Resistance Levels – Gold, Euro, Crude Oil, T-Bonds
4. Commodities Support and Resistance Levels – Corn, Wheat, Beans, Silver
5. Futures Economic Reports for Wednesday April 24, 2013

Hello Traders,

For 2013 I would like to wish all of you discipline and patience in your trading! 


Day Trading Commodities with Crude Oil Futures

Crude Oil Futures volatility offers a “different market personality” than stock index futures. Here is some of the things you need to know about day trading crude oil futures:

Date: April 23, 2013


By: Ilan Levy-Mayer, Cannon Trading Commodities Broker & VP


Crude Oil is one of MY favorite futures market for day trading. Before I dive in and share with you how the volatility in crude oil fits my risk tolerance for day trading and provide a couple of chart examples, we should review some of the specifications of Crude Oil Futures

Crude Oil Futures have monthly expiration. So each month we trade a different contract month, so one needs to know when is the first notice day and last trading day for crude oil futures in order to always make sure we are trading the proper month with the most liquidity and avoid any chance of getting into delivery situation.

Next is the contract size. Crude Oil futures are based on 100,000 barrels. To be honest from a day trading perspective all I care is that each tick or 1 cent fluctuation is $10 against me or in my favor per contract. That means that a move from 92.94 to 92.74 = $200.

Another factor is trading hours. At the time I am sharing my thoughts with you, April 8th 2013, crude oil futures trade on the CME Globex platform and trade from 5 PM CDT until the next day at 4 PM CDT. That is 23 of straight trading hours. I definitely don’t recommend day trading this market 23 hours…but it is good to know the trading hours.

Volume in crude oil futures is pretty good to trade in my opinion. Averaging about 300,000 contracts per day.

One last pointer to touch on is the API (American Petroleum Institute) report that normally comes out Wednesday at 9:30 CDT (on short weeks, holidays etc. , this report will be pushed to Thursday at 10 AM CDT). I tell my clients that this report is way too volatile and I like to be out 5 minutes before and not resume trading 5 minutes until after the report comes out. This report by itself deserves a writing but on short, the report provides information on how our stock pile is doing ( = supply/demand)  and the market will move based on the numbers versus what was expected. Again as a day trader, your main job is to know about this report, when it comes out and in my opinion stay out of the market during this time…Read Full Article.


Like us on FacebookFollow us on TwitterView our profile on LinkedInFind us on Google+Cannon Trading Futures Trading Resistance & Support Levels and Economic ReportsFind us on Yelp

Futures Trading Levels and Economic Reports for April 11, 2013


Jump to a section in this post:

1. Market Commentary
2. Futures Support and Resistance Levels – S&P, Nasdaq, Dow Jones, Russell 2000, Dollar Index
3. Commodities Support and Resistance Levels – Gold, Euro, Crude Oil, T-Bonds
4. Commodities Support and Resistance Levels – Corn, Wheat, Beans, Silver
5. Futures Economic Reports for Thursday April 11, 2013

Hello Traders,

For 2013 I would like to wish all of you discipline and patience in your trading! 


Daily Price Limit Methodology Now Effective 
Implemented Monday, April 8, 2013

Changes to the daily price limit methodology for CME and CBOT equity index futures went into effect Monday, April 8, 2013, in coordination with rollout of Market Wide Circuit Breaker changes in the underlying cash equity market. These changes were deferred from an earlier planned rollout date on February 4.

As previously announced, Market Wide Circuit Breakers, or trading halts, for cash equity markets are now determined by declines in the S&P 500 Index (vs. the Dow Jones Industrial Average). Trading halt levels are as follows:


Levels as of
April 8, 2013

Effective Hours of 
Levels as of April 8, 2013

Level 1

7%

8:30 a.m. CT – 3:00 p.m. CT

Level 2

13%

Level 3

20%

Overnight

5%

3:00 p.m. CT – 4:15 p.m. CT;
5:00 p.m. CT – 8:30 a.m. CT


In addition, we have coordinated the following changes to CME and CBOT stock index futures’ daily price limits methodology with the rule changes in the underlying markets:

  • Implementation of daily price limits on stock index futures contracts (switching from the quarterly price limits currently used)
  • Application of daily price limits each day starting at 5:00 p.m. CT.
  • Reference price for daily price limits for the next trade date based on the 3:00 p.m. CT futures price:
    • Width of the equity index futures price limit band is based on the underlying cash equity index closing value.
    • Daily stock index futures price limits are published on the CME Group website prior to the CME Globex open at 5:00 p.m. CT.

For more information, visit cmegroup.com/eqpricelimits


Continue reading “Futures Trading Levels and Economic Reports for April 11, 2013”