Natural Gas Daily Chart + Futures Trading Levels for 02.22.24

Get Real Time updates and more by joining our Private Facebook Group!
Subscribe to our YouTube Channel


C5


We have a FULL day tomorrow with several reports, FED members talking and more….

Natural Gas bounced sharply on news that Chesapeake cuts production outlook

Cocoa continues it’s run into unknown territories….up over 4% today!

Natural Gas Daily Chart for review below:


92d1139a 8f36 4734 b233 8dc5cc93894c


stars

e35cb555 9ff3 4f00 9fe8 0655b28fbd90

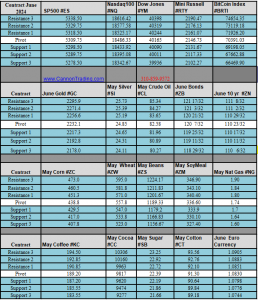
Daily Levels for February 22nd, 2024

200c25d6 f2a3 4027 9b53 daf37d2c2023

e2efe540 f5de 4e9d a356 c461773aa83d

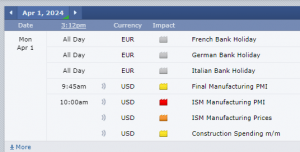
Economic Reports
provided by: ForexFactory.com
All times are Eastern Time ( New York)
f031220f dd92 4380 8bcb 35edc0d5f2cb

Improve Your Trading Skills

Get access to proprietary indicators and trading methods, consult with an experienced broker at 1-800-454-9572.

Explore trading methods. Register Here

3b644da2 2bee 4d39 8d98 5208a20bec39

* This is not a solicitation of any order to buy or sell, but a current market view provided by Cannon Trading Inc. Any statement of facts here in contained are derived from sources believed to be reliable, but are not guaranteed as to accuracy, nor they purport to be complete. No responsibility is assumed with respect to any such statement or with respect to any expression of opinion herein contained. Readers are urged to exercise their own judgement in trading.

Where do I take profit? + Futures Trading Levels for 02.21.24

Get Real Time updates and more by joining our Private Facebook Group!
Subscribe to our YouTube Channel


Trading Futures Platform CTS T4


FOMC Minutes tomorrow at 1 PM Central. Market moving event.

Lets talk about a “good problem”…you are in a winning trade, where should you exit?

Take a look at the video below for some ideas.


Projecting possible targets when trading futures


stars

e35cb555 9ff3 4f00 9fe8 0655b28fbd90

92a3e5ac 5b3b 4a28 b172 65279ea78bc8

Daily Levels for February 21st, 2024

9da09fdf e39a 407e 9398 b1274dc3fa54

e2efe540 f5de 4e9d a356 c461773aa83d

Economic Reports
provided by: ForexFactory.com
All times are Eastern Time ( New York)
faf15440 aa2c 41c4 974f eb2ea23cf1cd

Improve Your Trading Skills

Get access to proprietary indicators and trading methods, consult with an experienced broker at 1-800-454-9572.

Explore trading methods. Register Here

3b644da2 2bee 4d39 8d98 5208a20bec39

* This is not a solicitation of any order to buy or sell, but a current market view provided by Cannon Trading Inc. Any statement of facts here in contained are derived from sources believed to be reliable, but are not guaranteed as to accuracy, nor they purport to be complete. No responsibility is assumed with respect to any such statement or with respect to any expression of opinion herein contained. Readers are urged to exercise their own judgement in trading.

Weekly Newsletter: Trading Alerts Via text! , President’s Day Trading Schedule

Get Real Time updates and more by joining our Private Facebook Group!
Subscribe to our YouTube Channel

C14

Cannon Futures Weekly Letter Issue # 1182

In this issue:
  • Important Notices – President’s Day Schedule
  • Trading Resource of the Week – Trade Alerts via Text/email
  • Hot Market of the Week – April Crude Oil
  • Broker’s Trading System of the Week – Unleaded Gasoline Swing Trading System
  • Trading Levels for Next Week
  • Trading Reports for Next Week


Important Events Coming Up –


5f9d2d98 6fc6 4c3b 94ed 77efa7f40b6f

Trading Resource of the Week : Real Time Email Alerts Directly to your Phone!

Self-Study Guide to Hedging with Grain and Oilseed Futures and Options. Regardless if you are a farmer, rancher or simply looking to trade grains and livestock futures, this guide will help you understand the ins and outs of trading and hedging using futures and options.
  • You will receive an email each time there is an entry or exit in a simple language along with the current price for that specific market.
  • A licensed series 3 broker at your fingertips
  • Email alerts available to US and Canada and Int’l clients
  • Alerts available for: Stock Indices, Grains, Metals, Rates, Currencies, Meats & Softs
  • Open an account* and receive the Trade Alerts free for 3 months ($357 value)
  • See an example of a recent trade alert for Gold Futures in the image below – the trade was still active as of Friday, Feb. 16th


Looking to sell gold on a bounce to 2023.0
Stop is 2062.0, target is 1981.0
0c2cf474 21fc 4ea3 8d9e d0722f0a75c6


stars

3b644da2 2bee 4d39 8d98 5208a20bec39


  • Hot Market of the Week – April Crude Oil
Hot market of the week is provided by QT Market Center, A Swiss army knife charting package that’s not just for Hedgers, Cooperatives and Farmers alike but also for Spread traders, Swing traders and shorter time frame application for intraday traders with a unique proprietary indicator that can be applied to your specific trading needs.
April Crude Oil
April crude oil activated upside PriceCounts last month but has continued to struggle with resistance around $78. If the chart can extend its rally with a sustained trade above $78, the first count would project a run to the 81.98 area.
PriceCounts – Not about where we’ve been , but where we might be going next!
586e7268 0243 4bbd af22 f10de38e4c04
The PriceCount study is a tool that can help to project the distance of a move in price. The counts are not intended to be an ‘exact’ science but rather offer a target area for the four objectives which are based off the first leg of a move with each subsequent count having a smaller percentage of being achieved. It is normal for the chart to react by correcting or consolidating at an objective and then either resuming its move or reversing trend. Best utilized in conjunction with other technical tools, PriceCounts offer one more way to analyze charts and help to manage your positions and risk. Learn more at www.qtchartoftheday.com
Trading in futures, options, securities, derivatives or OTC products entails significant risks which must be understood prior to trading and may not be appropriate for all investors. Past performance of actual trades or strategies is not necessarily indicative of future results.
  • Broker’s Trading System of the Week

With algorithmic trading systems becoming more prevalent in portfolio diversification, the following system has been selected as the broker’s choice for this month.
PRODUCT
SYSTEM TYPE
Swing
COST
USD 160 / monthly
Recommended Cannon Trading Starting Capital
$20,000
4cad38e6 221c 48e1 89cd bdb56306c583
The performance shown above is hypothetical in that the chart represents returns in a model account. The model account rises or falls by the average single contract profit and loss achieved by clients trading actual money pursuant to the listed system’s trading signals on the appropriate dates (client fills), or if no actual client profit or loss available – by the hypothetical single contract profit and loss of trades generated by the system’s trading signals on that day in real time (real‐time) less slippage, or if no real time profit or loss available – by the hypothetical single contract profit and loss of trades generated by running the system logic backwards on back adjusted data. Please read full disclaimer HERE.
Would you like to receive daily support & resistance levels?
Yes
S
No
S


Daily Levels for February 19th/20th 2024

59ec254b 1462 4ae3 8705 9ef8e663c191

Trading Reports for Next Week

168593ad e40a 4217 8b2d 5f21e38d4ed3
First Notice (FN), Last trading (LT) Days for the Week:
2804ff1a 6419 4ed2 ba19 4b85b35b5e90

Improve Your Trading Skills

Get access to proprietary indicators and trading methods, consult with an experienced broker at 1-800-454-9572.

Explore trading methods. Register Here

* This is not a solicitation of any order to buy or sell, but a current market view provided by Cannon Trading Inc. Any statement of facts here in contained are derived from sources believed to be reliable, but are not guaranteed as to accuracy, nor they purport to be complete. No responsibility is assumed with respect to any such statement or with respect to any expression of opinion herein contained. Readers are urged to exercise their own judgement in trading.

Short Term Options Strategies + Futures Trading Levels for 02.16.24

Get Real Time updates and more by joining our Private Facebook Group!
Subscribe to our YouTube Channel


Options trading


President’s Day is this Monday, view modified Schedule here.


4 MIN READ

Short-Term Options in Commodities: Potential Benefits and Applications Part 2

By Adila McHich CMEGroup.com

Short-terms options are flexible tools for tactical trading strategies to mitigate specific event risks or make a directional bet on price movement in the short term. The trading volume of these types of options in commodities has grown tremendously in recent years because they appeal to different types of traders regardless of their time horizon or thesis. This article, which is Part 2 of a two-part series explains the macro and idiosyncratic (commodity-specific) market events and their applications using short-term options in commodities.

Commodity prices are determined based on a confluence of macro and idiosyncratic factors. As such, commodity price fluctuations are largely driven by fundamental (supply/demand) and cyclical factors (macro) tied to the business cycle and the economic activity, in addition to other exogenous market events such as geopolitical risk and weather events. These various factors can sometimes morph into a jump risk (tail risk), especially if the market event is significant enough and unanticipated. The short duration of these options offers more flexibility to target a specific market event.

Examples of economic data releases:

  • ISM manufacturing index
  • Central bank announcements
  • GDP growth
  • Unemployment rate
  • Consumer Price Index, Producer Price Index
  • Consumer confidence, etc.

Example 1: Using Crude Oil Weekly options for directional trade on the ISM

A trader expects oil prices to rise in response to the release of the ISM Manufacturing index which measures the activity of the manufacturing sector. This leading indicator is important and closely watched by the market because it is used as a proxy for the overall state of the U.S. economy. A level of 50 and above reflects economic expansion while below 50 signals a contraction. The ISM tends to move in tandem with oil prices in the long run as the result of their linkage from the demand side. Chart 1 depicts the intertwined relationship between ISM index and price changes of oil. The YoY oil prices changes are used to remove the cyclicality variations. An increase in ISM indicates a rise in manufacturing activity that requires more oil as input which would consequently lead to an increase in oil demand and prices. Additionally, this long-term linkage gives insight into the underlying momentum of the economy and oil markets and their projected trajectories. Though, this relationship can sometimes be decoupled in the short term due to other factors that affect oil prices such supply shocks (OPEC meeting, geopolitical event etc.)

Chart 1: Strong relationship between the ISM and Crude Oil

➜ Finish Article


stars

e35cb555 9ff3 4f00 9fe8 0655b28fbd90

Daily Levels for February 16th, 2024

121df5e3 1df7 4cfd be9d f32fb7548225

e2efe540 f5de 4e9d a356 c461773aa83d

Economic Reports
provided by: ForexFactory.com
All times are Eastern Time ( New York)
17996599 1413 4f53 a108 73bcdfa841fd

Improve Your Trading Skills

Get access to proprietary indicators and trading methods, consult with an experienced broker at 1-800-454-9572.

Explore trading methods. Register Here

3b644da2 2bee 4d39 8d98 5208a20bec39

* This is not a solicitation of any order to buy or sell, but a current market view provided by Cannon Trading Inc. Any statement of facts here in contained are derived from sources believed to be reliable, but are not guaranteed as to accuracy, nor they purport to be complete. No responsibility is assumed with respect to any such statement or with respect to any expression of opinion herein contained. Readers are urged to exercise their own judgement in trading.

Watch out for these Tbills auctions! Buy/Sell Algo + Futures Trading Levels for 02.15.24

Get Real Time updates and more by joining our Private Facebook Group!
Subscribe to our YouTube Channel


C13


Treasury Auctions and Earnings

By Mark O’Brien, Senior Broker


There’s no shortage of trade guidance / advice / market news available to provide futures traders with reasoning for a market move.  Charts showing a market’s direction – or lack thereof – technical indicators, even a trader’s gut reaction can qualify as a reason to enter a position.  For short-term traders, here are a few others that lately have moved the financial markets more than usual and are worthy of consideration:


Earnings reports: we’re heading into the tail end of earning season and while most of the major U.S. companies have released their quarterly reports, there are still some on the horizon that can be catalysts for jolts in the markets.


Treasury auctions: at regularly scheduled dates, the federal government auctions three types of securities: bills, notes, and Treasury inflation-protected securities (TIPS). The Treasury auctions an astonishing quantity of securities.  In calendar year 2003, it auctioned $3.42 trillion of securities: $2.78 trillion of bills, $616 billion of notes, and $26 billion of TIPS.  Lately, the results of some of these auctions have also jostled financial markets.


Finally, take a look at one of the indicators developed in-house by the Cannon Trading team, headed by our vice president, Ilan Levy-Mayer.

Red arrows are a sell, blue arrows are a buy . Red bars are “sell territory”, green bars are “buy territory” and black bars are neutral. The chart below will show you examples of some good trades as well as not so good.

For a free trial of the indicator, click here.


74bec916 23ae 47ba 96b4 d55a2eaf3cd6


stars

e35cb555 9ff3 4f00 9fe8 0655b28fbd90

Daily Levels for February 15th, 2024

e0887aac 30d1 48d9 b3bc 26d42410ef31

d536c132 d3ce 47ff 8099 79b752e3652b

Economic Reports
provided by: ForexFactory.com
All times are Eastern Time ( New York)
7be049af caf2 4388 ac8b 9fbb1c391a0a

Improve Your Trading Skills

Get access to proprietary indicators and trading methods, consult with an experienced broker at 1-800-454-9572.

Explore trading methods. Register Here

3b644da2 2bee 4d39 8d98 5208a20bec39

* This is not a solicitation of any order to buy or sell, but a current market view provided by Cannon Trading Inc. Any statement of facts here in contained are derived from sources believed to be reliable, but are not guaranteed as to accuracy, nor they purport to be complete. No responsibility is assumed with respect to any such statement or with respect to any expression of opinion herein contained. Readers are urged to exercise their own judgement in trading.

Natural Gas lows, Market Sell off Post CPI + Futures Trading Levels for 02.14.24

Get Real Time updates and more by joining our Private Facebook Group!
Subscribe to our YouTube Channel


C3


  • Take a look at Natural Gas new lows…..
  • What about Cocoa new highs….
  • Today’s CPI was as good as advertised…take a look at NQ 1 minute chart below from today
  • May Coffee, Cotton, Cocoa are now front months due to higher volume in the May contract
  • Busy week ahead with many reports. See image below.


NQ 1 min chart from today’s CPI , market moving report.


b64f96ff 5983 428e b7bf d3f269a4c5bb


stars

e35cb555 9ff3 4f00 9fe8 0655b28fbd90

92a3e5ac 5b3b 4a28 b172 65279ea78bc8

Daily Levels for February 14th, 2024

32eb8c3c 242c 42be 8388 acd444ca4346

b2843954 59a1 437a b480 9ae8d8fc780f

Economic Reports
provided by: ForexFactory.com
All times are Eastern Time ( New York)
c5f1fa3d 5a4a 4c2d a2fc 4c9d5d9a1b1c

Improve Your Trading Skills

Get access to proprietary indicators and trading methods, consult with an experienced broker at 1-800-454-9572.

Explore trading methods. Register Here

3b644da2 2bee 4d39 8d98 5208a20bec39

* This is not a solicitation of any order to buy or sell, but a current market view provided by Cannon Trading Inc. Any statement of facts here in contained are derived from sources believed to be reliable, but are not guaranteed as to accuracy, nor they purport to be complete. No responsibility is assumed with respect to any such statement or with respect to any expression of opinion herein contained. Readers are urged to exercise their own judgement in trading.

CPI Pre Market tomorrow morning + Futures Trading Levels 2.13.2024

Get Real Time updates and more by joining our Private Facebook Group!
Subscribe to our YouTube Channel


Margin Trading


CPI Pre Market tomorrow morning 7:30 A.M. CST


Some clearing firms are increasing the day trade margin requirements, prior to and immediately following the release.

The market exhibits serious, sharp moves during some of these events, especially if the number falls outside the expectations of the market.


  • The Consumer Price Index likely rose 2.9% over the year ending January, the slowest year-over-year inflation since March 2021, forecasters predict.


  • Policymakers at the Federal Reserve are watching inflation data closely to determine how soon, and how quickly, to cut the Fed’s key interest rate.


  • The CPI, a widely-watched gauge of inflation compiled by the Bureau of Labor Statistics, likely rose 2.9% over 12 months ending January, the lowest in nearly three years, according to a survey of economists by Dow Jones Newswires and the Wall Street Journal.


  • Forecasters are anticipating January’s report to more than wipe out an unwelcome uptick in December.


  • This and other inflation data over the next few months could be key in determining how soon, and how quickly, the Federal Reserve will cut its benchmark interest rate.


Plan your trade and trade your plan


stars

e35cb555 9ff3 4f00 9fe8 0655b28fbd90

Daily Levels for February 13th, 2024

b7a9ff8b 29e7 4b85 b710 17a5042fb62a


Economic Reports
provided by: ForexFactory.com
All times are Eastern Time ( New York)
e5b19a00 823f 44d9 a643 cc86feda04c3

Improve Your Trading Skills

Get access to proprietary indicators and trading methods, consult with an experienced broker at 1-800-454-9572.

Explore trading methods. Register Here

3b644da2 2bee 4d39 8d98 5208a20bec39

* This is not a solicitation of any order to buy or sell, but a current market view provided by Cannon Trading Inc. Any statement of facts here in contained are derived from sources believed to be reliable, but are not guaranteed as to accuracy, nor they purport to be complete. No responsibility is assumed with respect to any such statement or with respect to any expression of opinion herein contained. Readers are urged to exercise their own judgement in trading.

Weekly Newsletter: Trading Alerts Via text! , 1099s and levels for Feb. 12th

Get Real Time updates and more by joining our Private Facebook Group!
Subscribe to our YouTube Channel

Abstract financial candlestick chart with line graph and stock numbers in Double exposure style background

Cannon Futures Weekly Letter Issue # 1181

In this issue:
  • Important Notices –  1099 Forms, Valentines Day, Chinese New year
  • Trading Resource of the Week – Trade Alerts via Text/email
  • Hot Market of the Week – March SoyMeal
  • Broker’s Trading System of the Week – Unleaded Gasoline Swing Trading System
  • Trading Levels for Next Week
  • Trading Reports for Next Week


Important Notices –

    • 1099 forms will be generated for all futures trading accounts held by US clients that placed any trades during the 2023 calendar year. Traders should expect to receive their 1099 forms via mail, email or through their portal in early February.
    1099 forms will be provided directly from the FCM to the client.
Important Events Coming Up:
  • Chinese New Year
  • CPI
  • Valentines day
  • Earnings
  • Fed Speakers
  • More Data including PPI


Trading Resource of the Week : Real Time Email Alerts Directly to your Phone!

Self-Study Guide to Hedging with Grain and Oilseed Futures and Options. Regardless if you are a farmer, rancher or simply looking to trade grains and livestock futures, this guide will help you understand the ins and outs of trading and hedging using futures and options.
  • You will receive an email each time there is an entry or exit in a simple language along with the current price for that specific market.
  • A licensed series 3 broker at your fingertips
  • Email alerts available to US and Canada and Int’l clients
  • Alerts available for: Stock Indices, Grains, Metals, Rates, Currencies, Meats & Softs
  • Open an account* and receive the Trade Alerts free for 3 months ($357 value)
  • See an example of a recent trade alert for Coffee Futures in the image below


1cdfd658 2c3a 45f2 8cac f3f8126057e9


stars

3b644da2 2bee 4d39 8d98 5208a20bec39


  • Hot Market of the Week – March Soymeal
Hot market of the week is provided by QT Market Center, A Swiss army knife charting package that’s not just for Hedgers, Cooperatives and Farmers alike but also for Spread traders, Swing traders and shorter time frame application for intraday traders with a unique proprietary indicator that can be applied to your specific trading needs.
March Meal
March soymeal resumed its slide where the chart is approaching its third downside PriceCount objective in the $340 area. It would be normal to get a reaction after completing the objective in the form of a near term consolidation or corrective trade, at least. The low percentage fourth count to $231 is not shown here for relevancy but the weekly chart shows significant downside potential remains on a longer term basis.
PriceCounts – Not about where we’ve been , but where we might be going next!
518b9594 5976 414d 9b1b 85573720c2e0
The PriceCount study is a tool that can help to project the distance of a move in price. The counts are not intended to be an ‘exact’ science but rather offer a target area for the four objectives which are based off the first leg of a move with each subsequent count having a smaller percentage of being achieved. It is normal for the chart to react by correcting or consolidating at an objective and then either resuming its move or reversing trend. Best utilized in conjunction with other technical tools, PriceCounts offer one more way to analyze charts and help to manage your positions and risk. Learn more at www.qtchartoftheday.com
Trading in futures, options, securities, derivatives or OTC products entails significant risks which must be understood prior to trading and may not be appropriate for all investors. Past performance of actual trades or strategies is not necessarily indicative of future results.
  • Broker’s Trading System of the Week

With algorithmic trading systems becoming more prevalent in portfolio diversification, the following system has been selected as the broker’s choice for this month.
PRODUCT
SYSTEM TYPE
Swing
COST
USD 160 / monthly
Recommended Cannon Trading Starting Capital
$20,000
4cad38e6 221c 48e1 89cd bdb56306c583
The performance shown above is hypothetical in that the chart represents returns in a model account. The model account rises or falls by the average single contract profit and loss achieved by clients trading actual money pursuant to the listed system’s trading signals on the appropriate dates (client fills), or if no actual client profit or loss available – by the hypothetical single contract profit and loss of trades generated by the system’s trading signals on that day in real time (real‐time) less slippage, or if no real time profit or loss available – by the hypothetical single contract profit and loss of trades generated by running the system logic backwards on back adjusted data. Please read full disclaimer HERE.
Would you like to receive daily support & resistance levels?
Yes
S
No
S


Daily Levels for February 5th 2024

10d11613 d5ca 43cf 9695 562ec2d7cf28

Trading Reports for Next Week

18aabfe9 1021 419a b50e a39a26af08fa
First Notice (FN), Last trading (LT) Days for the Week:
08f73578 cef1 4260 a3b2 3e334caded13

Improve Your Trading Skills

Get access to proprietary indicators and trading methods, consult with an experienced broker at 1-800-454-9572.

Explore trading methods. Register Here

* This is not a solicitation of any order to buy or sell, but a current market view provided by Cannon Trading Inc. Any statement of facts here in contained are derived from sources believed to be reliable, but are not guaranteed as to accuracy, nor they purport to be complete. No responsibility is assumed with respect to any such statement or with respect to any expression of opinion herein contained. Readers are urged to exercise their own judgement in trading.

Micro Treasury Yield Futures + Futures Trading Levels for 02.09.24

Get Real Time updates and more by joining our Private Facebook Group!
Subscribe to our YouTube Channel


C12


4 MIN READ

US TREASURY

Spreading Treasury Yield Futures

By CME Group

05 FEB 2024

Although the Federal Reserve (the Fed) has been on pause when it comes to interest rate hikes since the summer of 2023, economic uncertainty still looms. The Fed is reducing the size of its balance sheet by decreasing holdings of Treasury and mortgage backed securities, and it is ambiguous on when the first rate cuts will take place.

Given the uncertain economic environment, it is as important as ever to manage Treasury yield curve risk.

Treasury yields

The United States Treasury market stands as one of the largest and most crucial financial markets globally, playing a pivotal role in the functioning of the global economy. The magnitude of the U.S. Treasury market reflects its significance as a safe haven for investors, central banks and institutions seeking low-risk assets. Treasury maturities across the yield serve as an important reference point for risk management across various markets.

➜ Finish Article


stars

e35cb555 9ff3 4f00 9fe8 0655b28fbd90

Daily Levels for February 9th, 2024

#ES, #NQ, #YM, #RTY, #XBT, #GC, #SI, #CL, #ZB, #6E, #ZC, #ZW, #ZS, #ZM, #NG

b0ba1776 c0cd 4536 92c1 eef6595d7173

Economic Reports
provided by: ForexFactory.com
All times are Eastern Time ( New York)
7224192c 2777 44cf 84f0 d0e9b0e478e9

Improve Your Trading Skills

Get access to proprietary indicators and trading methods, consult with an experienced broker at 1-800-454-9572.

Explore trading methods. Register Here

3b644da2 2bee 4d39 8d98 5208a20bec39

* This is not a solicitation of any order to buy or sell, but a current market view provided by Cannon Trading Inc. Any statement of facts here in contained are derived from sources believed to be reliable, but are not guaranteed as to accuracy, nor they purport to be complete. No responsibility is assumed with respect to any such statement or with respect to any expression of opinion herein contained. Readers are urged to exercise their own judgement in trading.
Cocoa all Time Highs! + Futures Trading Levels for 02.08.24

Get Real Time updates and more by joining our Private Facebook Group!
Subscribe to our YouTube Channel


C10

New Highs and New Lows…..

By Mark O’Brien, Senior Broker

Traders, keep an eye out for market movement across asset classes for trading opportunities – including beyond those markets you’re typically focused on.  With dozens of commodities available for trading on the major U.S. futures exchanges, there’s potential out there.


Softs: 


Among the market sectors most traders follow closely, “Softs” is not high up the list.  Yet similarly to other well-known futures contracts such as stock indexes, interest rate futures, energies, metals and grains, the softs category includes some of the world benchmarks for their underlying commodity, such as cocoa, coffee, orange juice and sugar.


As well, we’re seeing recent price movement in some of these commodities that can be described as exceptional.  For example, it’s not hyperbole to say that the price of March cocoa has skyrocketed over the last month – from both sides of ±$4,200/ton coming into the new year to today’s $5,410/ton close.  That’s a ±$12,000 per contract move (contract size: 10 metric tons).  This is an all-time high for the contract.

Monthly Cocoa Chart for your review below!


After trading up to its own all-time highs above $4.00/lb. around mid-Nov., March orange juice sliced (pun intended) ±25% of its contract value, down below $3.00/lb. by mid-Jan with a $2.9065 close on Jan. 16.  This is a ±$15,000 move.  Yet this sell-off was brief as the contract then surged ±$1.00 back to today’s 10-cent up limit close of $3.9095, another ±$15,000 per contract move – in 16 trading days.


Indexes: 


Telling of all-time-highs would be lacking today without mentioning the E-mini S&P 500 and E-mini Nasdaq.  As of this typing the March E-mini S&P 500 futures contract is trading up ±40 points, nearly 10 points above Monday’s intraday high and ±15 points above the 5000 threshold.  As well, the March E-mini NASDAQ has made a ±200-point move up to its own all-time highs at ±17,850.  For the E-mini S&P 500, this marks a ±$40,000 per contract move since its last recent low back on Oct. 27.


Energy: 


In a comparison of contrasts, March natural gas settled below $2.00 today to set a new life-of-contract low and furthering a ±$4,000 per contract move in less than a month – with scarcely a retort by bulls.


March Cocoa Futures Chart

stars

e35cb555 9ff3 4f00 9fe8 0655b28fbd90

Daily Levels for February 8th, 2024

#ES, #NQ, #YM, #RTY, #XBT, #GC, #SI, #CL, #ZB, #6E, #ZC, #ZW, #ZS, #ZM, #NG

d536c132 d3ce 47ff 8099 79b752e3652b

Economic Reports
provided by: ForexFactory.com
All times are Eastern Time ( New York)
956ce77f 3c0f 47f1 895e bf11034c1ab4

Improve Your Trading Skills

Get access to proprietary indicators and trading methods, consult with an experienced broker at 1-800-454-9572.

Explore trading methods. Register Here

3b644da2 2bee 4d39 8d98 5208a20bec39

* This is not a solicitation of any order to buy or sell, but a current market view provided by Cannon Trading Inc. Any statement of facts here in contained are derived from sources believed to be reliable, but are not guaranteed as to accuracy, nor they purport to be complete. No responsibility is assumed with respect to any such statement or with respect to any expression of opinion herein contained. Readers are urged to exercise their own judgement in trading.