Intra Day Turning Points 2.15.2017

Connect with Us! Use Our Futures Trading Levels and Economic Reports RSS Feed.

Like us on FacebookFollow us on TwitterView our profile on LinkedInFind us on Google+Cannon Trading Futures Trading Resistance & Support Levels and Economic ReportsFind us on Yelp  

____________________________________________________________________

Voted #1 Blog and #1 Brokerage Services on TraderPlanet for 2016!!  

____________________________________________________________________

Below you will see screen shots from our E-Futures Int’l software along with my diamond ALGO which can be displayed on the platform. 

The diamond ALGO tries to predict turning points in the market and comes with a few simple rules to provide trader with another tool/ approach in their trading arsenal. 

Crude Oil 18 Ticks Range Bar 

Crude oil 18 ticks range bar
 
Gold 18 Ticks Range Bar
   

About Range Bar Charts:

A Range Bar chart is constructed of bars that indicate price movement as a way to help expose trends and volatility. A bar is created each time the bar range (high to low) is equal to some value that you set in preferences.

Would you like to have access to my DIAMOND ALGO as shown above and be able to apply for any market and any time frame on your own PC ?   You can now have a three weeks free trial where I enable the ALGO along with few studies.

To start your trial, please visit: https://www.cannontrading.com/tools/intraday-futures-trading-signals

Hypothetical performance results have many inherent limitations, some of which are described below.  No representation is being made that any account will or is likely to achieve profits or losses similar to those shown.  In fact, there are frequently sharp differences between hypothetical performance results and the actual results subsequently achieved by any particular trading program.

One of the limitations of hypothetical performance results is that they are generally prepared with the benefit of hindsight.  In addition, hypothetical trading does no involve financial risk, and no hypothetical trading record can completely account for the impact of financial risk in actual trading.  For example, the ability to withstand losses or to adhere to a particular trading program in spite of trading losses are material points which can also adversely affect actual trading results.  There are numerous other factors related to the markets in general or to the implementation of any specific trading program which cannot be fully accounted for in the preparation of hypothetical performance results and all of which can adversely affect actual trading results.

Continue reading “Intra Day Turning Points 2.15.2017”

Video on Day Trading Futures 12.07.2016

Connect with Us! Use Our Futures Trading Levels and Economic Reports RSS Feed.

Like us on FacebookFollow us on TwitterView our profile on LinkedInFind us on Google+Cannon Trading Futures Trading Resistance & Support Levels and Economic ReportsFind us on Yelp

  1. Good article: OPEC to Seek More Oil-Output Cuts from Nonmembers
  2. A good video on daytrading  futures using overbought/oversold indicators (crude oil in this case): https://www.youtube.com/watch?v=qhP-mtpTvE4&t=27s
  3. Last but not least,

Don’t forget to vote for us!! It takes 8 seconds, even if you voted before, they allow voting on daily basis!….vote here!

Dont forget to vote for us!! It takes 8 seconds…. vote here!

Continue reading “Video on Day Trading Futures 12.07.2016”

Day Trading Crude Oil Futures 6.08.2016

Connect with Us! Use Our Futures Trading Levels and Economic Reports RSS Feed.

Like us on FacebookFollow us on TwitterView our profile on LinkedInFind us on Google+Cannon Trading Futures Trading Resistance & Support Levels and Economic ReportsFind us on Yelp

1. Market Commentary
2. Futures Support and Resistance Levels – S&P, Nasdaq, Dow Jones, Russell 2000, Dollar Index
3. Commodities Support and Resistance Levels – Gold, Euro, Crude Oil, T-Bonds
4. Commodities Support and Resistance Levels – Corn, Wheat, Beans, Silver
5. Futures Economic Reports for Wednesday June 08, 2016

Hello Traders,

For 2016 I would like to wish all of you discipline and patience in your trading!

Voted #1 futures trading blog! 

Crude Oil numbers tomorrow morning. As of lately it has been one of the more followed reports by all markets…..

I wrote this piece about day trading crude oil futures a couple of years ago and it is still very valid in my opinion:

Trading 102: Day Trading Using fear and greed ( using Crude Oil futures as an example)

Crude Oil Futures volatility offers a “different market personality” than stock index futures. Here is some of the things you need to know about day trading crude oil futures:

By: Ilan Levy-Mayer, Cannon Trading Commodities Broker & VP

Crude Oil is one of MY favorite futures markets for day trading. Before I dive in and share with you how the volatility in crude oil fits my risk tolerance for day trading and provide a couple of chart examples, we should review some of the specifications of Crude Oil Futures.

Crude Oil Futures have monthly expiration. So each month we trade a different contract month, so one needs to know when the first notice day and last trading day for crude oil futures are, in order to always make sure we are trading the proper month with the most liquidity and avoid any chance of getting into a delivery situation.

Next is the contract size. Crude Oil futures are based on 1000 barrels. To be honest from a day trading perspective all I care is that each tick or 1 cent fluctuation is $10 against me or in my favor per contract. That means that a move from 92.94 to 92.74 = $200.

Continue reading “Day Trading Crude Oil Futures 6.08.2016”

Using Tick and Volume Charts for Future Day Traders 4.22.2016

Connect with Us! Use Our Futures Trading Levels and Economic Reports RSS Feed.

Like us on FacebookFollow us on TwitterView our profile on LinkedInFind us on Google+Cannon Trading Futures Trading Resistance & Support Levels and Economic ReportsFind us on Yelp

1. Market Commentary
2. Futures Support and Resistance Levels – S&P, Nasdaq, Dow Jones, Russell 2000, Dollar Index
3. Commodities Support and Resistance Levels – Gold, Euro, Crude Oil, T-Bonds
4. Commodities Support and Resistance Levels – Corn, Wheat, Beans, Silver
5. Futures Economic Reports for Friday April 22, 2016

Hello Traders,

For 2016 I would like to wish all of you discipline and patience in your trading!

Voted #1 futures trading blog!

Greetings!

Why I like to use tick and volume charts for scalping

Today I decided to touch more on an educational feature rather than provide a certain market outlook.

Many of my clients and blog readers know that when it comes to short term trading I am a fan of using volume charts, tick charts, range bar charts and Renko charts rather than the traditional time charts like the 1 minutes, 5 minutes etc.

My rule of thumb is that if you as a trader make decisions based on charts that are less than 15 minutes time frame, it may be worth your time to research, back test and do some homework as to potentially using other type of charts like volume charts , Range charts etc.

Volume charts will draw a new bar once a user defined number of contracts traded. Example mini SP 10,000 volume chart will draw a new bar once 10,000 contracts traded.

Range bar charts will draw new charts once price action has exceeded a user pre define price or ticks range. Example might be an 18 ticks range bar chart on crude oil.

Continue reading “Using Tick and Volume Charts for Future Day Traders 4.22.2016”

Silver Futures Insight 3.17.2016

Connect with Us! Use Our Futures Trading Levels and Economic Reports RSS Feed.

Like us on FacebookFollow us on TwitterView our profile on LinkedInFind us on Google+Cannon Trading Futures Trading Resistance & Support Levels and Economic ReportsFind us on Yelp

1. Market Commentary
2. Futures Support and Resistance Levels – S&P, Nasdaq, Dow Jones, Russell 2000, Dollar Index
3. Commodities Support and Resistance Levels – Gold, Euro, Crude Oil, T-Bonds
4. Commodities Support and Resistance Levels – Corn, Wheat, Beans, Silver
5. Futures Economic Reports for Thursday March 17, 2016

Hello Traders,

For 2016 I would like to wish all of you discipline and patience in your trading!

Greetings!

A note on Silver by my colleague, John Thorpe who has over 25 years of experience starting on the floor of the CBOT.

Silver Futures

Here is a daily chart with simple moving averages, a 25 day slow  and 10 day fast, the buy signal is still intact. With the fast(red) SMA penetrating the slow (blue) from underneath. RSI in the neutral range.

Daily Silver Futures Chart With Simple Moving Averages

Managing Your Futures Trading/Position 3.15.2016

Connect with Us! Use Our Futures Trading Levels and Economic Reports RSS Feed.

Like us on FacebookFollow us on TwitterView our profile on LinkedInFind us on Google+Cannon Trading Futures Trading Resistance & Support Levels and Economic ReportsFind us on Yelp

1. Market Commentary
2. Futures Support and Resistance Levels – S&P, Nasdaq, Dow Jones, Russell 2000, Dollar Index
3. Commodities Support and Resistance Levels – Gold, Euro, Crude Oil, T-Bonds
4. Commodities Support and Resistance Levels – Corn, Wheat, Beans, Silver
5. Futures Economic Reports for Tuesday March 15, 2016

Hello Traders,

For 2016 I would like to wish all of you discipline and patience in your trading!

Greetings! 

FRONT MONTH for STOCK INDEX is JUNE!!

A note on managing trade size by my colleague, John Thorpe who has over 25 years of experience starting on the floor of the CBOT.

Managing your trading/position size is crucial to long term success regardless of style.

Daytrading, Swing or long term position trading.

In order to select the size you will employ make a mental note of three things before you trade.  The Foundation of Trading your plan is first determining the size you will be employing, the number of contracts.

We must assume your risk capital is fixed.

1)  How liquid is the contract I will be trading?

Are there frequent price gaps, lack of continuity with bid/ask spreads.

What is the Open Interest and Volume relative to other contracts in the same industry, index , futures contract type.

Continue reading “Managing Your Futures Trading/Position 3.15.2016”

The Power of Diversification When Trading 3.08.2016

Connect with Us! Use Our Futures Trading Levels and Economic Reports RSS Feed.

Like us on FacebookFollow us on TwitterView our profile on LinkedInFind us on Google+Cannon Trading Futures Trading Resistance & Support Levels and Economic ReportsFind us on Yelp

1. Market Commentary
2. Futures Support and Resistance Levels – S&P, Nasdaq, Dow Jones, Russell 2000, Dollar Index
3. Commodities Support and Resistance Levels – Gold, Euro, Crude Oil, T-Bonds
4. Commodities Support and Resistance Levels – Corn, Wheat, Beans, Silver
5. Futures Economic Reports for Tuesday March 8, 2016

Hello Traders,

For 2016 I would like to wish all of you discipline and patience in your trading!

Greetings!

The Power of Diversification When Trading

I believe that if you are only trading (daytrading) one market you may be missing out on diversifying yourself by trading other markets.

Just like if you have a portfolio that is not diversified, you expose yourself to more risk, I think the same holds with futures.

I like to daytrade at least 3 markets or at least follow 3 markets and see which ones offers set ups that I like. If you only trade the ES, you will have many days during the year where there is lower volatility, tight ranges and perhaps just “dead days”. However if you are also following bonds and crude oil you have better chances to get in trade set ups that you prefer. Not only that there are times that one trade will make up for another one that is not going so well etc.

Continue reading “The Power of Diversification When Trading 3.08.2016”

Gold Futures Heikin-Ashi Chart 3.03.2016

Connect with Us! Use Our Futures Trading Levels and Economic Reports RSS Feed.

Like us on FacebookFollow us on TwitterView our profile on LinkedInFind us on Google+Cannon Trading Futures Trading Resistance & Support Levels and Economic ReportsFind us on Yelp

1. Market Commentary
2. Futures Support and Resistance Levels – S&P, Nasdaq, Dow Jones, Russell 2000, Dollar Index
3. Commodities Support and Resistance Levels – Gold, Euro, Crude Oil, T-Bonds
4. Commodities Support and Resistance Levels – Corn, Wheat, Beans, Silver
5. Futures Economic Reports for Friday March 4, 2016

Hello Traders,

For 2016 I would like to wish all of you discipline and patience in your trading!

Greetings!

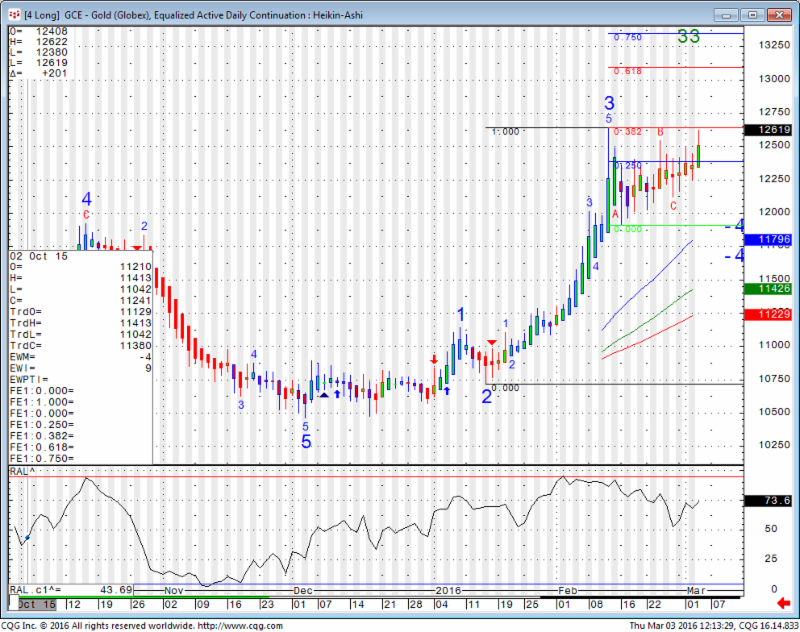
Daily chart of the Gold futures for your review. Heikin-Ashi chart type.

We are trading against first major resistance since this bounce started and tomorrow is monthly unemployment!! Could be a volatile day:

Gold Futures Heikin-Ashi Chart March 3rd, 2016

Continue reading “Gold Futures Heikin-Ashi Chart 3.03.2016”