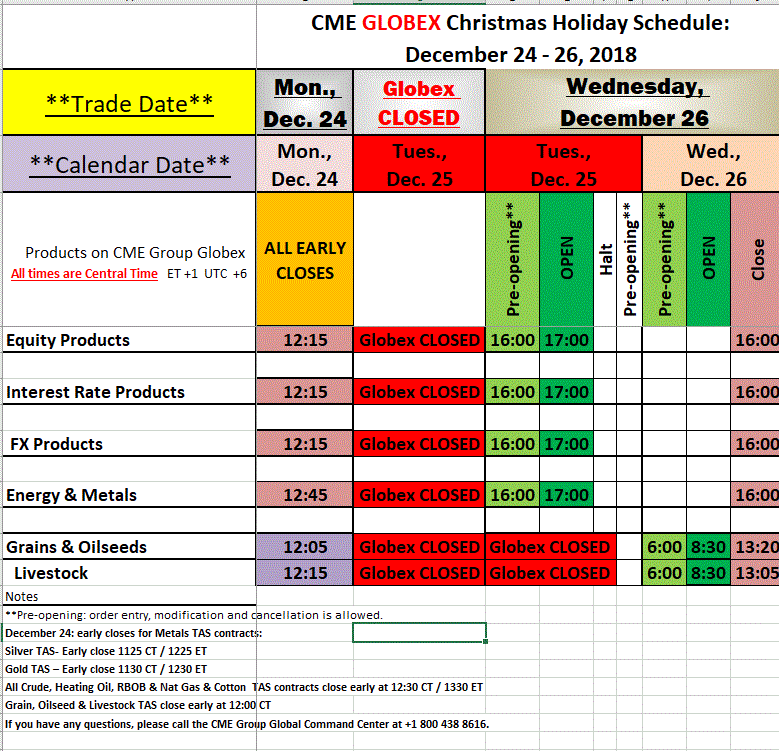
Labor Day Trading Schedule + Trading Levels for 8.30.2018

____________________________________________________________________

Voted #1 Blog and #1 Brokerage Services on TraderPlanet for 2016!!  

____________________________________________________________________

Dear Traders,

Like us on FaceBook!
Get Real Time updates and market alerts on Twitter!
Labor Day Summary below and full details available here.

52d9c330 bf93 496f 9fb6 17abdc9866dc

Good Trading

Trading Futures, Options on Futures, and retail off-exchange foreign currency transactions involves substantial risk of loss and is not suitable for all investors.  You should carefully consider whether trading is suitable for you in light of your circumstances, knowledge, and financial resources. You may lose all or more of your initial investment. Opinions, market data, and recommendations are subject to change at any time.

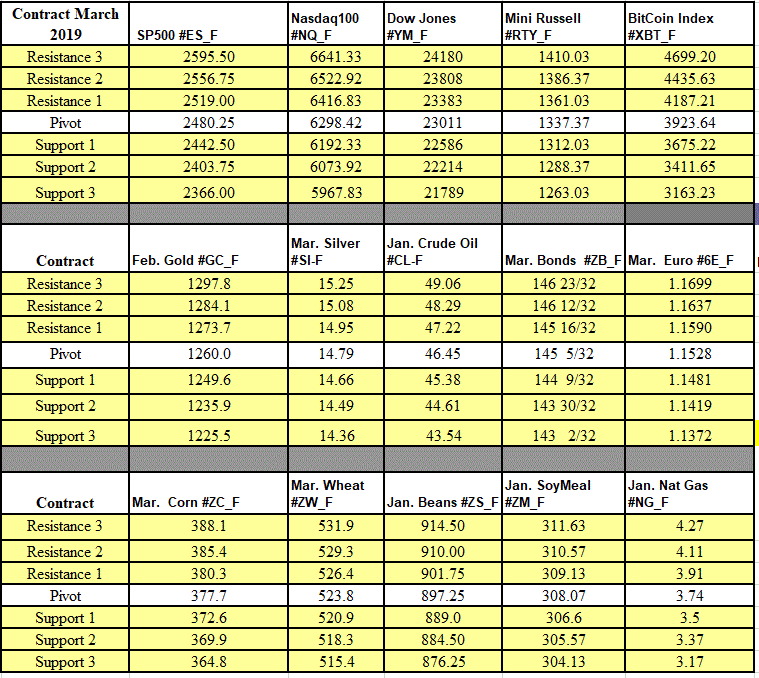
Futures Trading Levels

08-30-2018


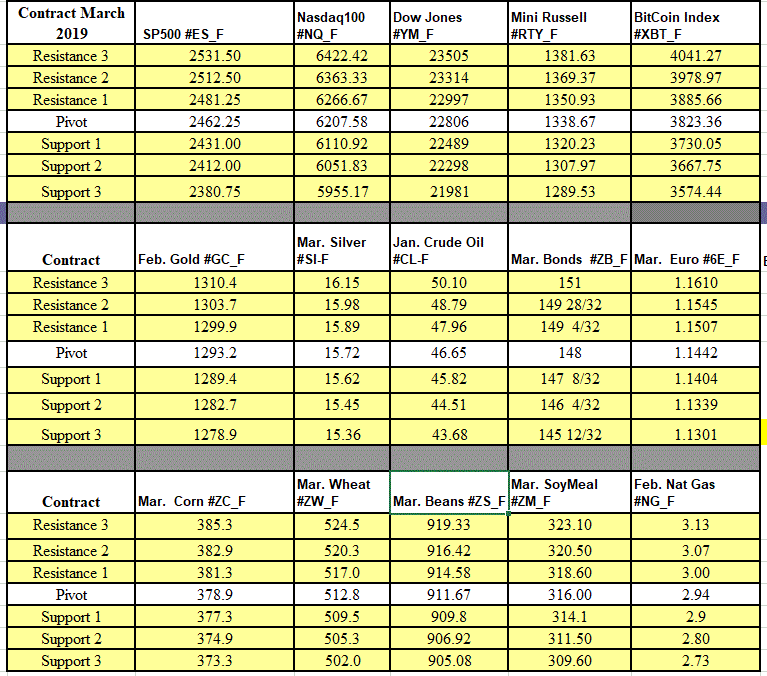
Contract September 2018  SP500 #ES_F Nasdaq100  #NQ_F Dow Jones  #YM_F Mini Russell #RTY_F BitCoin Index #XBT_F
Resistance 3 2942.33 7790.92 26334 1754.43 7317.37
Resistance 2 2929.92 7731.58 26260 1746.37 7219.30
Resistance 1 2922.33 7699.67 26199 1741.03 7110.54
Pivot 2909.92 7640.33 26125 1732.97 7012.47
Support 1 2902.33 7608.42 26064 1727.63 6903.71
Support 2 2889.92 7549.08 25990 1719.57 6805.64
Support 3 2882.33 7517.17 25929 1714.23 6696.88
Contract December Gold #GC_F Sept. Silver #SI-F Oct. Crude Oil #CL-F Sept.  Bonds  #ZB_F Sept.  Euro #6E_F
Resistance 3 1221.1 15.01 71.56 145 10/32 1.1796
Resistance 2 1217.0 14.93 70.66 145  1/32 1.1760
Resistance 1 1214.8 14.87 70.18 144 26/32 1.1740
Pivot 1210.7 14.79 69.28 144 17/32 1.1704
Support 1 1208.5 14.74 68.80 144 10/32 1.1684
Support 2 1204.4 14.66 67.90 144  1/32 1.1648
Support 3 1202.2 14.60 67.42 143 26/32 1.1628
Contract Dec.  Corn #ZC_F Dec. Wheat #ZW_F Nov. Beans #ZS_F Dec. SoyMeal #ZM_F Oct. Nat Gas #NG_F
Resistance 3 362.3 561.5 850.25 311.60 2.93
Resistance 2 360.7 553.3 847.00 309.80 2.90
Resistance 1 358.6 547.5 841.50 307.50 2.89
Pivot 356.9 539.3 838.25 305.70 2.86
Support 1 354.8 533.5 832.8 303.4 2.8
Support 2 353.2 525.3 829.50 301.60 2.81
Support 3 351.1 519.5 824.00 299.30 2.80

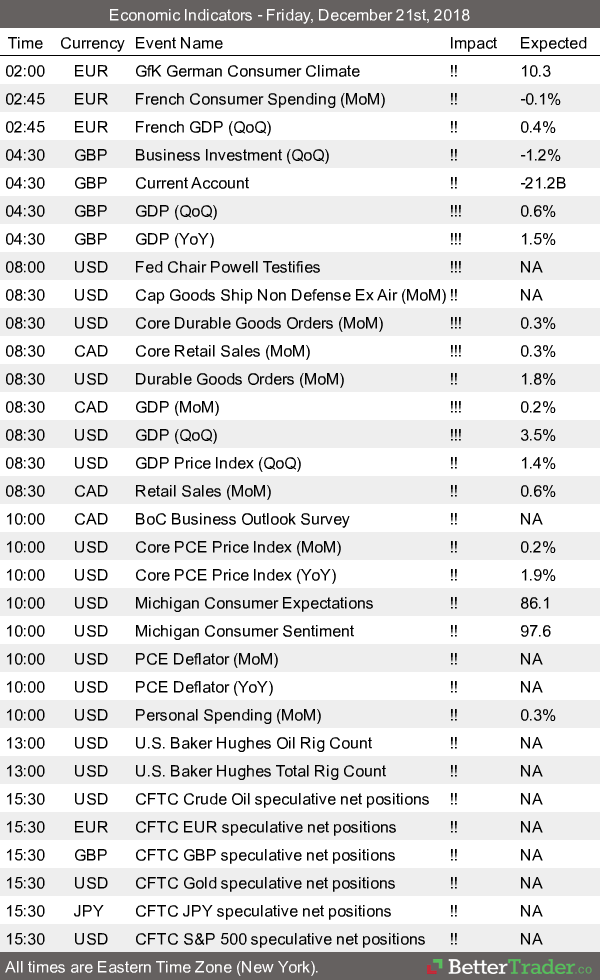
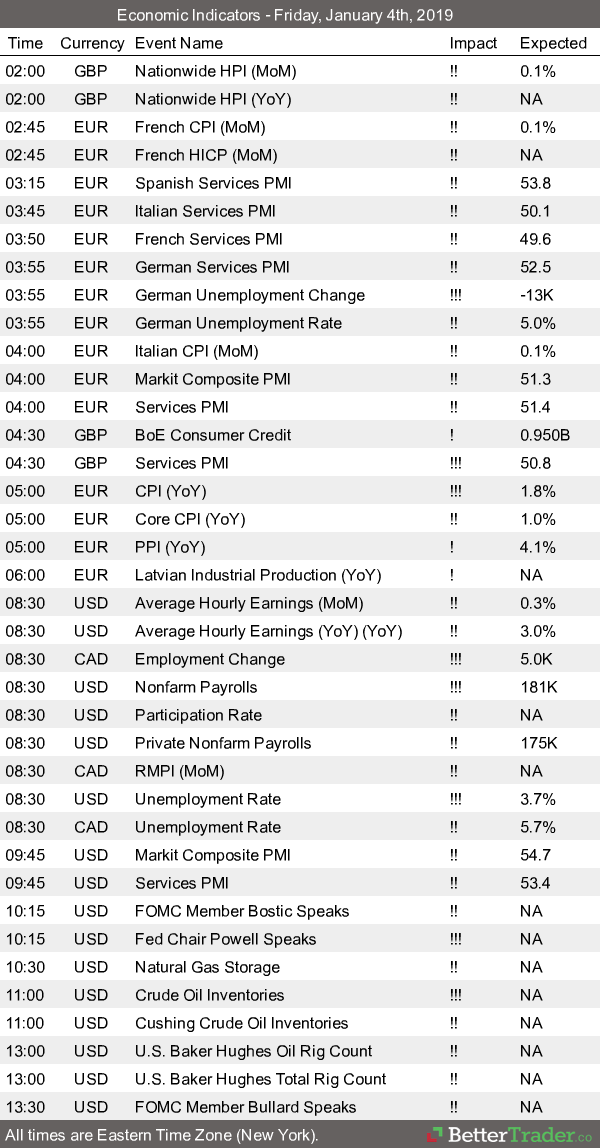
Economic Reports, source: 

www.forexfactory.com


Date 4:18pm Currency Impact Detail Actual Forecast Previous Graph
ThuAug 30  2:00am EUR
German Import Prices m/m
0.0% 0.5%
All Day EUR
German Prelim CPI m/m
0.1% 0.3%
3:00am EUR
Spanish Flash CPI y/y
2.2% 2.2%
3:55am EUR
German Unemployment Change
-8K -6K
4:30am GBP
M4 Money Supply m/m
0.2% -0.3%
GBP
Mortgage Approvals
65K 66K
GBP
Net Lending to Individuals m/m
5.5B 5.4B
Tentative EUR
Italian 10-y Bond Auction
2.87|1.4
8:30am USD
Core PCE Price Index m/m
0.2% 0.1%
USD
Personal Spending m/m
0.4% 0.4%
USD
Personal Income m/m
0.3% 0.4%
USD
Unemployment Claims
214K 210K
10:30am USD
Natural Gas Storage
58B 48B
1:30pm EUR
German Buba President Weidmann Speaks
7:01pm GBP
GfK Consumer Confidence
-10 -10


This is not a solicitation of any order to buy or sell, but a current market view provided by Cannon Trading Inc. Any statement of facts here in contained are derived from sources believed to be reliable, but are not guaranteed as to accuracy, nor they purport to be complete. No responsibility is assumed with respect to any such statement or with respect to any expression of opinion herein contained. Readers are urged to exercise their own judgement in trading.
Labor Day 2018 Holiday Schedule for CME / Globex and ICE Exchange

Labor Day 2018 Holiday Schedule for CME / Globex and ICE Exchange

52d9c330 bf93 496f 9fb6 17abdc9866dc


*Dates and times are subject to change

If you have any questions, please call the CME Global Command Center at +1 800 438 8616, in Europe at +44 800 898 013 or in Asia at +65 6532 5010

Globex®  Labor Day 2018 Holiday Schedule

More details at: http://www.cmegroup.com/tools-information/holiday-calendar.html 

Ice Futures Labor Day 2018 Holiday Trading Schedule

Detailed holiday hours: https://www.theice.com/holiday-hours

The above sources were compiled from sources believed to be reliable. Cannon Trading assumes no responsibility for any errors or omissions.  It is meant as an alert to events that may affect trading strategies and is not necessarily complete.  The closing times for certain contracts may have been rescheduled.

More Hikes on the Way? Trading Levels for 8.29.2018

____________________________________________________________________

Voted #1 Blog and #1 Brokerage Services on TraderPlanet for 2016!!  

____________________________________________________________________

Dear Traders,

Like us on FaceBook!
Get Real Time updates and market alerts on Twitter!
Fed’s Fork in the Road: Even Higher Rates or Pause?
By Blu Putnam, Chief Economist and Erik Norland, Senior Economist, CME Group
Highlights:
  • Markets skeptical of Fed’s signal for seven more rate hikes by 2020
  • Our base case is for two more increases before Fed goes on hold
  • Rate hikes based on ‘dot plot’ could raise risks of debt defaults, recession
  • Our analysis shows probability of a recession in 2020 is at 33% and rising
84ed7e45 9d87 4182 ac9a 5b675b331a0e

Good Trading

Trading Futures, Options on Futures, and retail off-exchange foreign currency transactions involves substantial risk of loss and is not suitable for all investors.  You should carefully consider whether trading is suitable for you in light of your circumstances, knowledge, and financial resources. You may lose all or more of your initial investment. Opinions, market data, and recommendations are subject to change at any time.

Futures Trading Levels

08-29-2018


Contract September 2018  SP500 #ES_F Nasdaq100  #NQ_F Dow Jones  #YM_F Mini Russell #RTY_F BitCoin Index #XBT_F
Resistance 3 2917.92 7630.08 26257 1751.20 7622.07
Resistance 2 2912.08 7613.67 26207 1743.40 7368.94
Resistance 1 2905.92 7597.08 26145 1737.20 7230.94
Pivot 2900.08 7580.67 26095 1729.40 6977.81
Support 1 2893.92 7564.08 26033 1723.20 6839.81
Support 2 2888.08 7547.67 25983 1715.40 6586.68
Support 3 2881.92 7531.08 25921 1709.20 6448.68
Contract December Gold #GC_F Sept. Silver #SI-F Oct. Crude Oil #CL-F Sept.  Bonds  #ZB_F Sept.  Euro #6E_F
Resistance 3 1231.7 15.33 70.13 145 26/32 1.1818
Resistance 2 1226.2 15.20 69.67 145 16/32 1.1784
Resistance 1 1216.8 14.99 69.14 144 31/32 1.1747
Pivot 1211.3 14.86 68.68 144 21/32 1.1713
Support 1 1201.9 14.66 68.15 144  4/32 1.1676
Support 2 1196.4 14.53 67.69 143 26/32 1.1642
Support 3 1187.0 14.32 67.16 143  9/32 1.1605
Contract Dec.  Corn #ZC_F Dec. Wheat #ZW_F Nov. Beans #ZS_F Dec. SoyMeal #ZM_F Oct. Nat Gas #NG_F
Resistance 3 367.0 532.0 856.92 315.80 2.91
Resistance 2 364.8 529.8 852.08 313.50 2.89
Resistance 1 360.5 526.5 842.67 309.10 2.87
Pivot 358.3 524.3 837.83 306.80 2.85
Support 1 354.0 521.0 828.4 302.4 2.8
Support 2 351.8 518.8 823.58 300.10 2.81
Support 3 347.5 515.5 814.17 295.70 2.79

Economic Reports, source: 

www.forexfactory.com

Date 4:06pm Currency Impact Detail Actual Forecast Previous Graph
WedAug 29 2:00am EUR
German GfK Consumer Climate
10.6 10.6
2:45am EUR
French Consumer Spending m/m
0.3% 0.1%
EUR
French Prelim GDP q/q
0.2% 0.2%
8:30am USD
Prelim GDP q/q
4.0% 4.1%
USD
Prelim GDP Price Index q/q
3.0% 3.0%
10:00am USD
Pending Home Sales m/m
0.3% 0.9%
10:30am USD
Crude Oil Inventories
-0.7M -5.8M


This is not a solicitation of any order to buy or sell, but a current market view provided by Cannon Trading Inc. Any statement of facts here in contained are derived from sources believed to be reliable, but are not guaranteed as to accuracy, nor they purport to be complete. No responsibility is assumed with respect to any such statement or with respect to any expression of opinion herein contained. Readers are urged to exercise their own judgement in trading.
Range Bar Chart Example & Trading Levels for 8.28.2018

____________________________________________________________________

Voted #1 Blog and #1 Brokerage Services on TraderPlanet for 2016!!  

____________________________________________________________________

Dear Traders,

Like us on FaceBook!
Get Real Time updates and market alerts on Twitter!
Traditionally, the week before labor Day Weekend is slow….This is when many large traders and professional traders take their vacations with the plans of coming back to full speed trading after Labor day. Today was a perfect example of that. Slow, low energy trading. Obviously, if major news come out, this can change things rather quickly but today’s slow type of trading, low energy markets brings me to share with you once more why I like using range bar, Renko charts and volume charts rather than time charts for day trading.
Below you will see 2 charts.
Same markets, same time of the day and SAME INDICATORS….I think you will be able to see the advantages of using the range bar and volume charts in this examples:
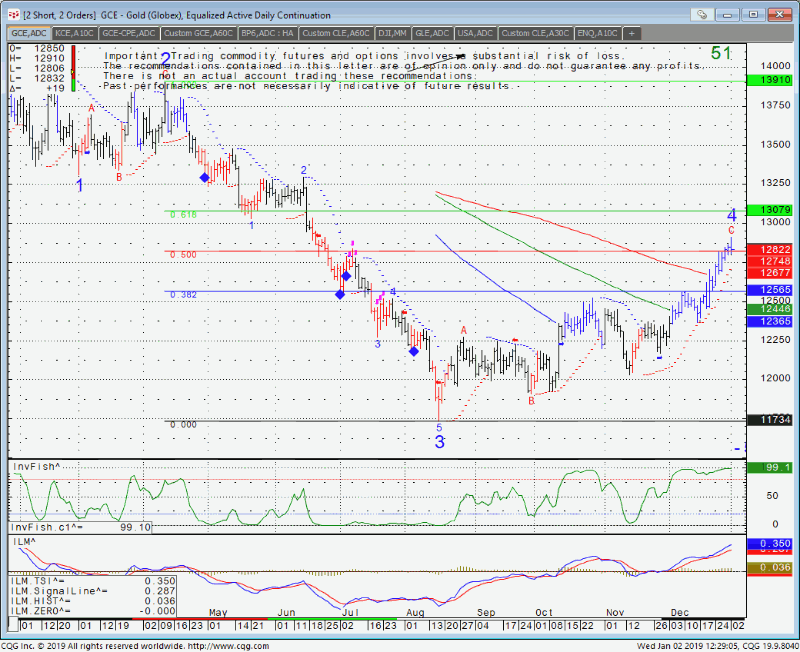
Gold chart from today ( Aug. 27th) using 10 minutes time frame:
53da2e48 c1cd 4486 a150 ac84f4fc4964
As you can see on the 10 minute chart, while we did get the blue buy arrow signal earlier, we also got two “fake” sell signals in the form of the red diamonds SIMPLY because time has passed, there was not much action in the market and the studies take on values as the bar closes.
Now look below , same time frame from today as well, using 24 tick RANGE bar chart:
b0cdf82f e16c 4c38 bd14 2c1901a3b5f4
No “fake” signals on this one…The ONLY signal we got today using this type of chart is the circled BLUE diamond. The range bars only completed 10 bars today as the market was simple slow….But were able to catch the nice up move early in the morning. If you look back in the same chart ( going back to the 23 of the month) you actually see that out of 7 signals, 6 were what I consider legit.
If you like to use the same indicators I am sharing in the charts above, you can try these proprietary indicators and ALGO for 3 weeks. This comes with a 15 minutes one on one remote session explaining the concept ( if interested).

Good Trading

Trading Futures, Options on Futures, and retail off-exchange foreign currency transactions involves substantial risk of loss and is not suitable for all investors.  You should carefully consider whether trading is suitable for you in light of your circumstances, knowledge, and financial resources. You may lose all or more of your initial investment. Opinions, market data, and recommendations are subject to change at any time.

Futures Trading Levels

08-28-2018


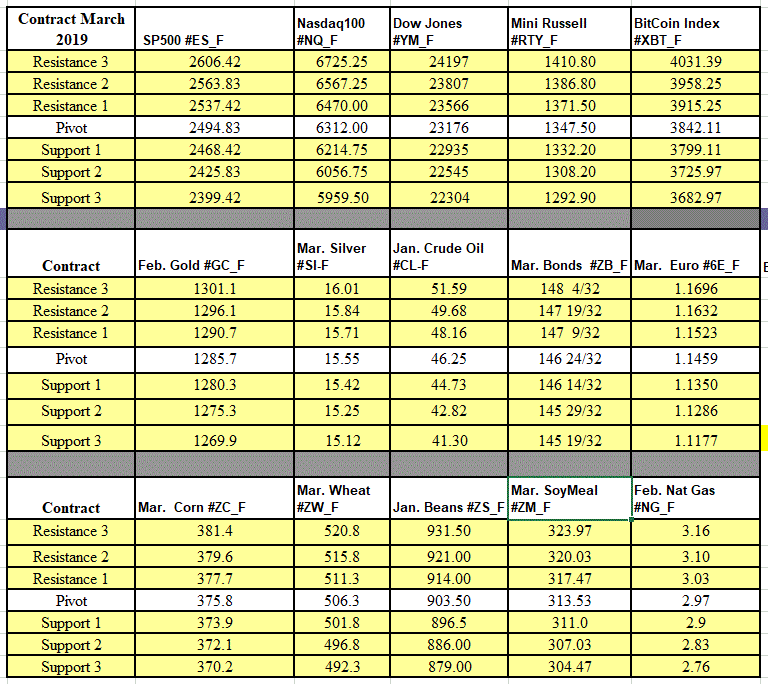
Contract September 2018  SP500 #ES_F Nasdaq100  #NQ_F Dow Jones  #YM_F Mini Russell #RTY_F BitCoin Index #XBT_F
Resistance 3 2927.92 7659.83 26438 1751.33 7154.15
Resistance 2 2913.58 7613.92 26260 1745.77 6958.79
Resistance 1 2905.42 7590.58 26161 1738.03 6844.69
Pivot 2891.08 7544.67 25983 1732.47 6649.33
Support 1 2882.92 7521.33 25884 1724.73 6535.23
Support 2 2868.58 7475.42 25706 1719.17 6339.87
Support 3 2860.42 7452.08 25607 1711.43 6225.77
Contract December Gold #GC_F Sept. Silver #SI-F Oct. Crude Oil #CL-F Sept.  Bonds  #ZB_F Sept.  Euro #6E_F
Resistance 3 1230.2 15.09 69.79 146 17/32 1.1837
Resistance 2 1224.5 14.99 69.38 146  7/32 1.1774
Resistance 1 1220.7 14.92 69.16 145 22/32 1.1737
Pivot 1215.0 14.82 68.75 145 12/32 1.1675
Support 1 1211.2 14.75 68.53 144 27/32 1.1638
Support 2 1205.5 14.65 68.12 144 17/32 1.1575
Support 3 1201.7 14.58 67.90 144 1.1538
Contract Dec.  Corn #ZC_F Dec. Wheat #ZW_F Nov. Beans #ZS_F Dec. SoyMeal #ZM_F Sept. Nat Gas #NG_F
Resistance 3 369.8 541.0 870.33 322.93 2.94
Resistance 2 366.5 537.0 861.92 319.47 2.93
Resistance 1 364.0 529.8 855.08 315.03 2.90
Pivot 360.8 525.8 846.67 311.57 2.89
Support 1 358.3 518.5 839.8 307.1 2.9
Support 2 355.0 514.5 831.42 303.67 2.85
Support 3 352.5 507.3 824.58 299.23 2.82

Economic Reports, source: 

www.forexfactory.com

Date 4:13pm Currency Impact Detail Actual Forecast Previous Graph
TueAug 28  4:00am EUR
M3 Money Supply y/y
4.3% 4.4%
EUR
Private Loans y/y
3.0% 2.9%
8:30am USD
Goods Trade Balance
-68.6B -67.9B
USD
Prelim Wholesale Inventories m/m
0.1% 0.1%
9:00am USD
S&P/CS Composite-20 HPI y/y
6.4% 6.5%
10:00am USD
CB Consumer Confidence
126.6 127.4
USD
Richmond Manufacturing Index
18 20
7:01pm GBP
BRC Shop Price Index y/y
-0.3%


This is not a solicitation of any order to buy or sell, but a current market view provided by Cannon Trading Inc. Any statement of facts here in contained are derived from sources believed to be reliable, but are not guaranteed as to accuracy, nor they purport to be complete. No responsibility is assumed with respect to any such statement or with respect to any expression of opinion herein contained. Readers are urged to exercise their own judgement in trading.
Mini NASDAQ & Support and Resistance Levels 8.24.2018

____________________________________________________________________

Voted #1 Blog and #1 Brokerage Services on TraderPlanet for 2016!!  

____________________________________________________________________

Dear Traders,

Like us on FaceBook!
Get Real Time updates and market alerts on Twitter!
A picture is worth a 1000 words….
Weekly chart of the mini NASDAQ for your review below.
This market ALMOST DOUBLED itself in 25 months…..
As you can see the ALGO I use has been signaling only longs during this time, starting with the BLUE SQUARE on June 2016 and continuing with the bars marked blue (= strong), bars marked blue along with green triangle ( =very strong) and an additional blue square ( = shift to long) this past May.
ccc20cc9 f435 44d4 943b b9e3f9b052de
PS:
All the ALGOs and signals in the world still cant make up for wise trade management and other factors that only look so easy in hindsight,. yet are so hard when you make decisions in live situations…..

Good Trading

Trading Futures, Options on Futures, and retail off-exchange foreign currency transactions involves substantial risk of loss and is not suitable for all investors.  You should carefully consider whether trading is suitable for you in light of your circumstances, knowledge, and financial resources. You may lose all or more of your initial investment. Opinions, market data, and recommendations are subject to change at any time.

Futures Trading Levels

08-24-2018


Contract September 2018  SP500 #ES_F Nasdaq100  #NQ_F Dow Jones  #YM_F Mini Russell #RTY_F BitCoin Index #XBT_F
Resistance 3 2882.42 7526.67 25916 1739.63 6638.83
Resistance 2 2876.08 7500.83 25841 1732.97 6561.67
Resistance 1 2867.42 7462.92 25756 1726.03 6484.55
Pivot 2861.08 7437.08 25681 1719.37 6407.39
Support 1 2852.42 7399.17 25596 1712.43 6330.27
Support 2 2846.08 7373.33 25521 1705.77 6253.11
Support 3 2837.42 7335.42 25436 1698.83 6175.99
Contract December Gold #GC_F Sept. Silver #SI-F Oct. Crude Oil #CL-F Sept.  Bonds  #ZB_F Sept.  Euro #6E_F
Resistance 3 1213.3 14.97 69.01 146  4/32 1.1674
Resistance 2 1208.3 14.86 68.57 145 30/32 1.1646
Resistance 1 1200.1 14.67 68.21 145 25/32 1.1603
Pivot 1195.1 14.56 67.77 145 19/32 1.1576
Support 1 1186.9 14.37 67.41 145 14/32 1.1533
Support 2 1181.9 14.26 66.97 145  8/32 1.1505
Support 3 1173.7 14.07 66.61 145  3/32 1.1462
Contract Dec.  Corn #ZC_F Dec. Wheat #ZW_F Nov. Beans #ZS_F Dec. SoyMeal #ZM_F Sept. Nat Gas #NG_F
Resistance 3 370.1 560.1 880.58 330.23 3.04
Resistance 2 368.2 553.9 875.17 327.37 3.01
Resistance 1 364.6 547.8 864.58 321.93 2.99
Pivot 362.7 541.7 859.17 319.07 2.96
Support 1 359.1 535.6 848.6 313.6 2.9
Support 2 357.2 529.4 843.17 310.77 2.92
Support 3 353.6 523.3 832.58 305.33 2.90

Economic Reports, source: 

https://app.bettertrader.com


cb24a01e ecac 43f1 b9cc b9b93e300228


This is not a solicitation of any order to buy or sell, but a current market view provided by Cannon Trading Inc. Any statement of facts here in contained are derived from sources believed to be reliable, but are not guaranteed as to accuracy, nor they purport to be complete. No responsibility is assumed with respect to any such statement or with respect to any expression of opinion herein contained. Readers are urged to exercise their own judgement in trading.
Day Trading Video, Trading Levels for 8.23.2018

____________________________________________________________________

Voted #1 Blog and #1 Brokerage Services on TraderPlanet for 2016!!  

____________________________________________________________________

Dear Traders,

Like us on FaceBook!
Get Real Time updates and market alerts on Twitter!
I have been asked before many times on how I like to day trade. While I definitely DON’T have a crystal ball, one method I like to use is looking for overbought and oversold conditions and try to play the counter trend set up.
Trading 101: Using overbought/oversold indicators to day trade crude oil ( video)

I recorded this video a few years ago, using one of our trading platforms, our charts and a few indicators/ALGOS I use.
After you watch the video, feel free to sign up for a free trial of the indicators/algos I use in the video  ( The ALGO is available for a trial using either sierra charts or e-futures Int’l ( OEC trader).
In the next few weeks I will share more on using breakoutstrend following and looking for pullbacks to get in with the trend and more.


Good Trading

Trading Futures, Options on Futures, and retail off-exchange foreign currency transactions involves substantial risk of loss and is not suitable for all investors.  You should carefully consider whether trading is suitable for you in light of your circumstances, knowledge, and financial resources. You may lose all or more of your initial investment. Opinions, market data, and recommendations are subject to change at any time.

Futures Trading Levels

08-23-2018


Contract September 2018  SP500 #ES_F Nasdaq100  #NQ_F Dow Jones  #YM_F Mini Russell #RTY_F BitCoin Index #XBT_F
Resistance 3 2893.42 7562.75 25977 1747.53 7233.50
Resistance 2 2880.83 7503.75 25907 1736.67 7056.36
Resistance 1 2871.42 7470.00 25818 1730.13 6743.41
Pivot 2858.83 7411.00 25748 1719.27 6566.27
Support 1 2849.42 7377.25 25659 1712.73 6253.32
Support 2 2836.83 7318.25 25589 1701.87 6076.18
Support 3 2827.42 7284.50 25500 1695.33 5763.23
Contract December Gold #GC_F Sept. Silver #SI-F Oct. Crude Oil #CL-F Sept.  Bonds  #ZB_F Sept.  Euro #6E_F
Resistance 3 1217.3 15.06 70.77 146  9/32 1.1724
Resistance 2 1212.8 14.97 69.43 146 1.1684
Resistance 1 1208.1 14.86 68.67 145 25/32 1.1654
Pivot 1203.6 14.76 67.33 145 16/32 1.1614
Support 1 1198.9 14.65 66.57 145  9/32 1.1583
Support 2 1194.4 14.56 65.23 145 1.1543
Support 3 1189.7 14.45 64.47 144 25/32 1.1513
Contract Dec.  Corn #ZC_F Sept. Wheat #ZW_F Nov. Beans #ZS_F Dec. SoyMeal #ZM_F Sept. Nat Gas #NG_F
Resistance 3 375.0 564.3 885.83 330.90 3.03
Resistance 2 373.3 558.4 882.42 329.20 3.01
Resistance 1 370.0 551.8 876.33 326.20 2.99
Pivot 368.3 545.9 872.92 324.50 2.97
Support 1 365.0 539.3 866.8 321.5 2.9
Support 2 363.3 533.4 863.42 319.80 2.93
Support 3 360.0 526.8 857.33 316.80 2.91

Economic Reports, source: 

https://app.bettertrader.com

9cff00f2 5f76 46a3 bd5a 15dbc2d8270c


This is not a solicitation of any order to buy or sell, but a current market view provided by Cannon Trading Inc. Any statement of facts here in contained are derived from sources believed to be reliable, but are not guaranteed as to accuracy, nor they purport to be complete. No responsibility is assumed with respect to any such statement or with respect to any expression of opinion herein contained. Readers are urged to exercise their own judgement in trading.
FOMC minutes tomorrow along with Energies report & Trading Levels for 8.22.2018

____________________________________________________________________

Voted #1 Blog and #1 Brokerage Services on TraderPlanet for 2016!!  

____________________________________________________________________

Dear Traders,

Like us on FaceBook!
Get Real Time updates and market alerts on Twitter!
October crude oil is front month.
We have FOMC minutes tomorrow along with home sales early on and the weekly energy report.
Check the reports schedule in section 3 of this newsletter and know what reports are coming, when they are out and if they have impact on the markets you trade specifically.


Good Trading

Trading Futures, Options on Futures, and retail off-exchange foreign currency transactions involves substantial risk of loss and is not suitable for all investors.  You should carefully consider whether trading is suitable for you in light of your circumstances, knowledge, and financial resources. You may lose all or more of your initial investment. Opinions, market data, and recommendations are subject to change at any time.

Futures Trading Levels

08-21-2018


Contract September 2018  SP500 #ES_F Nasdaq100  #NQ_F Dow Jones  #YM_F Mini Russell #RTY_F BitCoin Index #XBT_F
Resistance 3 2895.33 7535.58 26064 1759.90 6780.22
Resistance 2 2884.67 7493.92 25975 1742.40 6628.93
Resistance 1 2875.08 7452.33 25903 1730.90 6529.94
Pivot 2864.42 7410.67 25814 1713.40 6378.65
Support 1 2854.83 7369.08 25742 1701.90 6279.66
Support 2 2844.17 7327.42 25653 1684.40 6128.37
Support 3 2834.58 7285.83 25581 1672.90 6029.38
Contract December Gold #GC_F Sept. Silver #SI-F Oct. Crude Oil #CL-F Sept.  Bonds  #ZB_F Sept.  Euro #6E_F
Resistance 3 1213.3 14.95 67.62 146  5/32 1.1761
Resistance 2 1208.2 14.89 67.05 145 27/32 1.1692
Resistance 1 1204.5 14.82 66.44 145 15/32 1.1644
Pivot 1199.4 14.76 65.87 145  5/32 1.1575
Support 1 1195.7 14.69 65.26 144 25/32 1.1527
Support 2 1190.6 14.63 64.69 144 15/32 1.1458
Support 3 1186.9 14.56 64.08 144  3/32 1.1410
Contract Dec.  Corn #ZC_F Sept. Wheat #ZW_F Nov. Beans #ZS_F Dec. SoyMeal #ZM_F Sept. Nat Gas #NG_F
Resistance 3 381.3 564.4 902.25 333.60 3.04
Resistance 2 379.3 560.6 898.50 332.20 3.01
Resistance 1 376.8 554.2 892.25 329.70 3.00
Pivot 374.8 550.3 888.50 328.30 2.98
Support 1 372.3 543.9 882.3 325.8 3.0
Support 2 370.3 540.1 878.50 324.40 2.94
Support 3 367.8 533.7 872.25 321.90 2.93

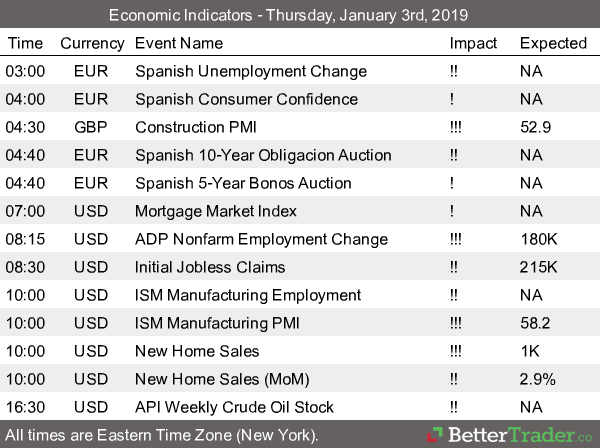
Economic Reports, source: 

https://app.bettertrader.com


88bb191f 0883 44b8 970a c9fca305e7c4


This is not a solicitation of any order to buy or sell, but a current market view provided by Cannon Trading Inc. Any statement of facts here in contained are derived from sources believed to be reliable, but are not guaranteed as to accuracy, nor they purport to be complete. No responsibility is assumed with respect to any such statement or with respect to any expression of opinion herein contained. Readers are urged to exercise their own judgement in trading.
The market beats differently every day…. & Trading Levels for 8.21.2018

____________________________________________________________________

Voted #1 Blog and #1 Brokerage Services on TraderPlanet for 2016!!  

____________________________________________________________________

Dear Traders,

Like us on FaceBook!
Get Real Time updates and market alerts on Twitter!
The markets behave differently on a daily basis….
There are days when the moves are so fast and so volatile that you feel like you are in a race all day and there are days when the volume, price action are so slow, your biggest battle is making sure you are not trying to make up “set ups” and get into a trade just to make yourself feel like you are “working” and of course there is the in between….
The type of trading days you are trading is as important and can dictate changes in strategy, stop loss and target settings and more.
You must realize as soon as you can what type of trading day you are in and use your notes, your journal to adjust based on your experience in past, similar days.
You can’t dance using the same moves when the music has different beats……
  • In my opinion there are 3 main types of trading days.
1. The most common day are two sided trading action with swings up and down – this type of trading day is most suitable for using support and resistance levels along with overbought/oversold indicators.
2. Strong trending days, mostly one directional – this type of trading day is the least common, many times will happen on Mondays and maybe 3-5 times a month at most – this type of trading day is most suitable for using ADX, MACD crossovers and pretty much looking for pullbacks to jump on the trend.
3. Slow and/or choppy trading days – this type of trading day is best suited for taking small profits from the market by looking at volume spikes, using stochastics as possible entry signals and usually wait for a pullback before jumping in.
  • A good question I’ve been asked is how can one asses what type of trading day we will have while the market is still trading….I have been doing some work in finding the answers and will be happy to hear feedback via email but here are some initial observations:
    1. Was the overnight session a wide, two sided trading range? If the answer is yes, good chances for similar trading day during the primary session (primary session is when the cash/stock market is open)
    2. Mondays have the highest chance for trending days
    3. The behavior of the first hour of trading can also suggests the type of action for the rest of the day.
    4. If the first 30 minutes of the trading day have good volume, better chances for type 1 or type 2 trading days.
    5. Low volume during the first 30 minutes can suggest a choppy (type 3 trading day)
 One thing I personally found that helped me in day trading, is switching from using “time charts” ( 1 minute/ 5 minutes etc.) to range bar charts, like 18 ticks range bar charts on crude oil and gold, 10 ticks range bar chart on ES and more.
You can read my full article on that topic at:


Good Trading

Trading Futures, Options on Futures, and retail off-exchange foreign currency transactions involves substantial risk of loss and is not suitable for all investors.  You should carefully consider whether trading is suitable for you in light of your circumstances, knowledge, and financial resources. You may lose all or more of your initial investment. Opinions, market data, and recommendations are subject to change at any time.

Futures Trading Levels

08-21-2018


Contract September 2018  SP500 #ES_F Nasdaq100  #NQ_F Dow Jones  #YM_F Mini Russell #RTY_F BitCoin Index #XBT_F
Resistance 3 2872.58 7486.25 25938 1718.23 6869.35
Resistance 2 2866.67 7453.50 25865 1710.57 6711.73
Resistance 1 2862.08 7417.00 25810 1704.53 6578.72
Pivot 2856.17 7384.25 25737 1696.87 6421.10
Support 1 2851.58 7347.75 25682 1690.83 6288.09
Support 2 2845.67 7315.00 25609 1683.17 6130.47
Support 3 2841.08 7278.50 25554 1677.13 5997.46
Contract December Gold #GC_F Sept. Silver #SI-F Oct. Crude Oil #CL-F Sept.  Bonds  #ZB_F Sept.  Euro #6E_F
Resistance 3 1208.0 15.04 66.51 146  8/32 1.1613
Resistance 2 1202.8 14.94 66.06 145 29/32 1.1558
Resistance 1 1199.9 14.84 65.74 145 22/32 1.1528
Pivot 1194.7 14.73 65.29 145 11/32 1.1472
Support 1 1191.8 14.63 64.97 145  4/32 1.1442
Support 2 1186.6 14.53 64.52 144 25/32 1.1387
Support 3 1183.7 14.43 64.20 144 18/32 1.1357
Contract Dec.  Corn #ZC_F Sept. Wheat #ZW_F Nov. Beans #ZS_F Dec. SoyMeal #ZM_F Sept. Nat Gas #NG_F
Resistance 3 384.3 580.4 914.42 339.93 3.02
Resistance 2 381.7 575.8 909.58 337.67 2.99
Resistance 1 379.1 569.2 901.42 334.13 2.97
Pivot 376.4 564.6 896.58 331.87 2.94
Support 1 373.8 557.9 888.4 328.3 2.9
Support 2 371.2 553.3 883.58 326.07 2.89
Support 3 368.6 546.7 875.42 322.53 2.87

Economic Reports, source: 

https://app.bettertrader.com


52ba5887 4062 4d80 9118 c9403964c627

This is not a solicitation of any order to buy or sell, but a current market view provided by Cannon Trading Inc. Any statement of facts here in contained are derived from sources believed to be reliable, but are not guaranteed as to accuracy, nor they purport to be complete. No responsibility is assumed with respect to any such statement or with respect to any expression of opinion herein contained. Readers are urged to exercise their own judgement in trading.

Videos on options basics + levels for tomorrow 08.16.18

____________________________________________________________________

Voted #1 Blog and #1 Brokerage Services on TraderPlanet for 2016!!  

____________________________________________________________________

Dear Traders,
Like us on FaceBook!
Get Real Time updates and market alerts on Twitter!
I have been asked by more than a few clients about options recently.
 
Some in terms of “insurance” , others in terms of speculation and more.
 
I decided to start with this short series of videos on options basics. By the CMEgroup.com 
 
1) Option Basics


For the FULL video list, please email me directly by replying back to this email.
 
As a reminder, our series 3 brokers are WELL VERSED with the ins and outs of options all the way to the advanced levels. Feel free to contact us at any time.
Good Trading!
Trading Futures, Options on Futures, and retail off-exchange foreign currency transactions involves substantial risk of loss and is not suitable for all investors.  You should carefully consider whether trading is suitable for you in light of your circumstances, knowledge, and financial resources. You may lose all or more of your initial investment. Opinions, market data, and recommendations are subject to change at any time.


Futures Trading Levels For Aug. 16th
Contract September 2018  SP500 #ES_F Nasdaq100  #NQ_F Dow Jones  #YM_F Mini Russell #RTY_F BitCoin Index #XBT_F
Resistance 3 2882.17 7599.58 25709 1728.60 7125.06
Resistance 2 2862.58 7532.17 25514 1713.00 6872.90
Resistance 1 2842.17 7451.33 25346 1693.70 6607.18
Pivot 2822.58 7383.92 25151 1678.10 6355.02
Support 1 2802.17 7303.08 24983 1658.80 6089.30
Support 2 2782.58 7235.67 24788 1643.20 5837.14
Support 3 2762.17 7154.83 24620 1623.90 5571.42
Contract December Gold #GC_F Sept. Silver #SI-F Sept. Crude Oil #CL-F Sept.  Bonds  #ZB_F Sept.  Euro #6E_F
Resistance 3 1218.2 15.61 68.74 145 19/32 1.1448
Resistance 2 1210.1 15.34 67.82 145  9/32 1.1415
Resistance 1 1196.2 14.89 66.35 144 31/32 1.1394
Pivot 1188.1 14.62 65.43 144 21/32 1.1361
Support 1 1174.2 14.16 63.96 144 11/32 1.1340
Support 2 1166.1 13.89 63.04 144  1/32 1.1307
Support 3 1152.2 13.44 61.57 143 23/32 1.1286
Contract Dec.  Corn #ZC_F Sept. Wheat #ZW_F Nov. Beans #ZS_F Dec. SoyMeal #ZM_F Sept. Nat Gas #NG_F
Resistance 3 381.9 546.8 887.67 344.93 2.99
Resistance 2 379.8 542.3 883.33 342.17 2.98
Resistance 1 377.9 537.3 876.17 336.73 2.96
Pivot 375.8 532.8 871.83 333.97 2.94
Support 1 373.9 527.8 864.7 328.5 2.9
Support 2 371.8 523.3 860.33 325.77 2.91
Support 3 369.9 518.3 853.17 320.33 2.89

Economic Reports, source: 

0bb8aa8a 9a77 46db 87d5 50f1b3f0cab8


This is not a solicitation of any order to buy or sell, but a current market view provided by Cannon Trading Inc. Any statement of facts here in contained are derived from sources believed to be reliable, but are not guaranteed as to accuracy, nor they purport to be complete. No responsibility is assumed with respect to any such statement or with respect to any expression of opinion herein contained. Readers are urged to exercise their own judgement in trading.

A Few Different Ways to Enter a Trade & Trading Levels for 8.15.2018

____________________________________________________________________

Voted #1 Blog and #1 Brokerage Services on TraderPlanet for 2016!!  

____________________________________________________________________

Dear Traders,

Like us on FaceBook!
Get Real Time updates and market alerts on Twitter!

A Few Different Ways to Enter a Trade

By Ilan Levy-Mayer, VP and Broker

Today I decided to touch more on an educational feature rather than provide a certain market outlook.

Many of my clients and blog readers know that when it comes to short term trading I am a fan of adjusting your trading technique/ game plan according to your assessment of the type of trading day that is developing in front of you.

There are so many different aspects to trading. From financial, fundamental, and emotional aspects of when to enter a trade, when to exit a trade and SO MUCH more in between…..

An important part of trading is trade entry. Assuming a trader knows why he/she is about to enter a trade the next step sounds simple right? simply buy or sell the contract you wish to trade….

 
84ed7e45 9d87 4182 ac9a 5b675b331a0e


Good Trading

Trading Futures, Options on Futures, and retail off-exchange foreign currency transactions involves substantial risk of loss and is not suitable for all investors.  You should carefully consider whether trading is suitable for you in light of your circumstances, knowledge, and financial resources. You may lose all or more of your initial investment. Opinions, market data, and recommendations are subject to change at any time.

Futures Trading Levels

08-15-2018


Contract September 2018  SP500 #ES_F Nasdaq100  #NQ_F Dow Jones  #YM_F Mini Russell #RTY_F BitCoin Index #XBT_F
Resistance 3 2864.17 7548.50 25484 1722.20 6662.20
Resistance 2 2853.83 7506.75 25409 1710.00 6474.40
Resistance 1 2846.42 7480.50 25342 1702.30 6272.06
Pivot 2836.08 7438.75 25267 1690.10 6084.26
Support 1 2828.67 7412.50 25200 1682.40 5881.92
Support 2 2818.33 7370.75 25125 1670.20 5694.12
Support 3 2810.92 7344.50 25058 1662.50 5491.78
Contract December Gold #GC_F Sept. Silver #SI-F Sept. Crude Oil #CL-F Sept.  Bonds  #ZB_F Sept.  Euro #6E_F
Resistance 3 1212.1 15.25 69.79 144 23/32 1.1534
Resistance 2 1208.9 15.18 69.08 144 18/32 1.1496
Resistance 1 1205.2 15.12 68.15 144 10/32 1.1434
Pivot 1202.0 15.05 67.44 144  5/32 1.1396
Support 1 1198.3 14.99 66.51 143 29/32 1.1334
Support 2 1195.1 14.92 65.80 143 24/32 1.1296
Support 3 1191.4 14.86 64.87 143 16/32 1.1234
Contract Dec.  Corn #ZC_F Sept. Wheat #ZW_F Nov. Beans #ZS_F Dec. SoyMeal #ZM_F Sept. Nat Gas #NG_F
Resistance 3 385.8 554.8 898.42 353.37 3.03
Resistance 2 381.5 548.4 889.58 346.13 3.00
Resistance 1 379.0 545.1 884.67 341.97 2.98
Pivot 374.8 538.7 875.83 334.73 2.95
Support 1 372.3 535.3 870.9 330.6 2.9
Support 2 368.0 528.9 862.08 323.33 2.90
Support 3 365.5 525.6 857.17 319.17 2.87

Economic Reports, source: 

https://app.bettertrader.com

45b9bacd 1e1e 4b79 a0c2 00f984cbc28a


This is not a solicitation of any order to buy or sell, but a current market view provided by Cannon Trading Inc. Any statement of facts here in contained are derived from sources believed to be reliable, but are not guaranteed as to accuracy, nor they purport to be complete. No responsibility is assumed with respect to any such statement or with respect to any expression of opinion herein contained. Readers are urged to exercise their own judgement in trading.