FOMC Results, Increased Volatility & Economic Reports 10.30.2014

Hello Traders,

For 2014 I would like to wish all of you discipline and patience in your trading!

Hello Traders,


FOMC lived up to the hype with increased volatility in many markets including stock indices, currencies, metals and mainly the bond market ( I recommend exploring the bond market for day-trading as it offers different personality and behavior look at previous blog post here ) 


  • Fed Ends QE While Keeping ‘Considerable Time’ Low-Rate Pledge

    attachment

    From bloomberg.com

    Read Full Story at bloomberg.com

    The Federal Reserve confirmed it will end an asset-purchase program that has added $1.66 trillion to its balance sheet and maintained a pledge to keep interest rates low for a “considerable time.” “Labor market conditions improved somewhat further, with solid job gains and a lower unemployment rate,” the Federal Open Market Committee said today in a statement in Washington. “A range of labor market indicators suggests that underutiliza tion of labor resources is gradually diminishing,” the panel said, modifying earlier language that “there remains signifi cant underutilization of labor resources.” Policy makers said that while … (full story)

FOMC Interest Rate Decision due 10.29.2014 at 14:00 ET & Economic Reports

Hello Traders,

For 2014 I would like to wish all of you discipline and patience in your trading!


The FOMC interest rate decision is due at 14:00 ET in the US tomorrow ( Wednesday, October 29th ).


FOMC days have different characteristics than other trading days. If you have traded for a while, check your trading notes from past FOMC days that may help you prepare for tomorrow.


I have shared this same post before more than a few times but I do encourage you to read and try to implement as I think tomorrow’s meeting may be even more volatile than the last few. 


if you are a newcomer, take a more conservative approach and make sure you understand that the news can really move the market.


The following are suggestions on trading during FOMC days: Continue reading “FOMC Interest Rate Decision due 10.29.2014 at 14:00 ET & Economic Reports”

FOMC Facts, Futures Levels & Economic Reports 10.28.2014

Hello Traders,

For 2014 I would like to wish all of you discipline and patience in your trading!


Two pointers I picked from an email service from factset.com that are worthy in looking ahead this week, as we will have FOMC statement this Wednesday:


Earnings metrics improve:

  • According to FactSet, the blended growth rate for Q3 S&P 500 EPS pushed up to 5.6% this week from 5.1% at the end of last week and 4.6% at the end of the quarter. In addition, of the 208 companies that have now reported results for Q3, 75% have beat consensus EPS expectations. This is up from 68% last week and ahead of the 73% four-quarter average. In the aggregate, companies are reporting EPS 3.8% ahead of the Street, slightly better than the 3.6% four-quarter average. As was the case last week, some of the better takeaways came from cyclical names where sentiment has been fairly depressed. MMM +8.1% reported a high-quality, margin-driven earnings beat and slightly raised the midpoint of F14 guidance. ITW +5.5% reported its best organic growth since 2011. Europe held up better and the company raised full-year guidance. HVAC leveraged plays like LII +15.1% and WSO +8.6% were some of the post-earnings standouts. UPS +3.4% had some upbeat commentary on the peak holiday shipping season. Outlook commentary following strong results from UNP +7.7% was also positive. Results and guidance from the airline sector also highlighted a still favorable domestic demand backdrop. Continue reading “FOMC Facts, Futures Levels & Economic Reports 10.28.2014”

Is the Wheat rally real or just a short covering bounce? & Levels 10.24.2014

Hello Traders,

For 2014 I would like to wish all of you discipline and patience in your trading!


Is the Wheat rally real or just a short covering bounce?

Along with the rest of the grain complex and many other commodities, the wheat market has taken a serious beating, declining from $7.64 in May to $4.66 in late September! That is a very serious drop in price (close to 40%!!) in a short period of time.


In recent weeks, the wheat market has bounced almost $0.60 from its lows and the big question longer term traders, as well as swing traders, are asking themselves, is the following: Is this just a chance to go short again or is this the beginning of a reversal to the upside.

Continue reading “Is the Wheat rally real or just a short covering bounce? & Levels 10.24.2014”

Weekly Futures Crude Number, Economic Reports & Levels 10-23-2014

Hello Traders,

For 2014 I would like to wish all of you discipline and patience in your trading!


Weekly crude numbers for WTI from EIA  for  28 years .

Wealth of information  for review if you are a crude oil/ energy trader!


  http://www.eia.gov/dnav/pet/hist/LeafHandler.ashx?n=pet&s=rwtc&f=w


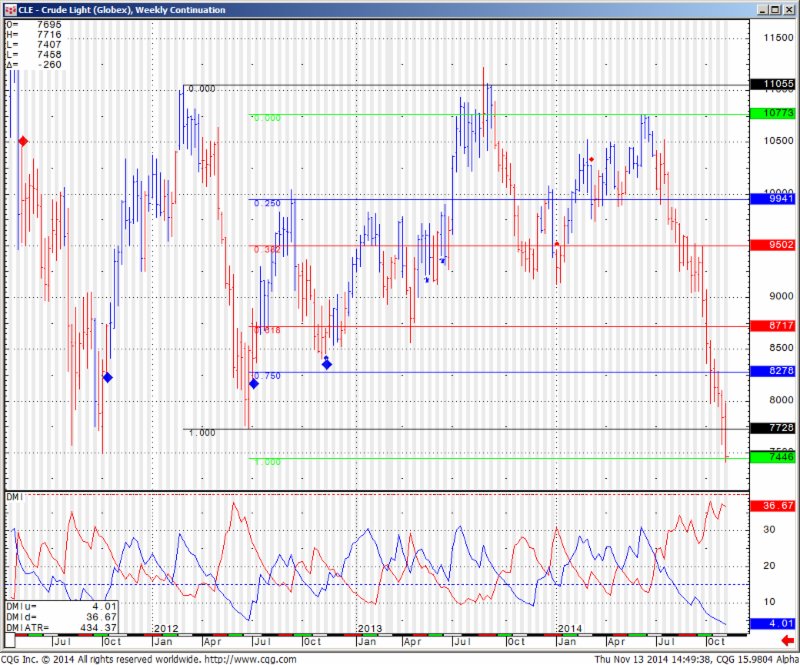
Trading myopothy blinds many traders so from time to time it is important to step back, take a deep breath and look at the price action from longer time frames” The action to the downside in the Crude oil market has been nothing short of breathtaking. ….

the longer term view(s) can illustrate ( on this chart supplied by U.S. Energy Information Administration).  That deeper sell offs and more volatile market moves could continue for some time .

Weekly chart for your review below:


842


Continue reading “Weekly Futures Crude Number, Economic Reports & Levels 10-23-2014”

Moves in the Futures Indices, Crude Oil & Gold, Economic Reports & Levels 10.16.2014

Hello Traders,

For 2014 I would like to wish all of you discipline and patience in your trading!

 I may sound like I keep repeating myself but make sure you are adapting to the different market conditions we are seeing compared to a month ago or so.

There is much higher volatility, speed of price change and wider ranges.

Moves today in bonds, S&P, Russell, Crude, Gold and many other markets were very sharp, fast and powerful. This obviously presents both risks and opportunities but for newcomers – mostly risk.

This is a good day to keep notes on in your journal. What caused the price action? What type of “bands” did the market have? How did you do as a trader? What can you do better and learn from for the next “Wild, crazy” day which may even happen tomorrow?


The biggest advice I can give on days like today is to make sure you don’t lose it….make sure you know what your daily loss limit is and step away if it gets triggered. This is one of those days where I have seen traders blow their whole account up…..So just make sure you live to trade another day!


Continue reading “Moves in the Futures Indices, Crude Oil & Gold, Economic Reports & Levels 10.16.2014”

Futures News, Economic Reports & Levels 10.14.2014

Hello Traders,

For 2014 I would like to wish all of you discipline and patience in your trading!


Weekly Wrap Up by www.TRADETHENEWS.COM  STAFF
Volatility Roller Coaster   

Volatility shook global markets this week, severely testing the long equity rally. Wednesday saw the biggest one-day gain of the year in the S&P500 and Thursday marked the biggest decline in the index since April. The VIX volatility index moved sharply higher, topping 20 for the first time since February. The downside ramp got underway thanks to disastrous German industrial data published on Monday and Tuesday. German August factory orders data declined 5.7% m/m (the biggest m/m drop since early 2009), led lower by a big slide in overseas orders. German August industrial production declined 4% m/m, much more than expected. In addition, the IMF cut its 2014 global growth forecast to from +3.4% to +3.3% and its 2015 forecast from +4.0% to +3.8%. The DJIA and S&P500 were down 2.5% a piece by Wednesday morning, and participants read deeply between the lines of the FOMC minutes to uncover the possibility of the Fed holding off on rate hikes longer, driving a sharp reversal. The sugar high didn’t last, and markets closed at the lows of the week (or much lower, in the case of the Nasdaq, which is right at its 200-day moving average). Ebola fear spread to new corners of the globe all week – the first confirmed transmission of the virus outside of Africa struck a nurse in Madrid – but nearly all the reports were false alarms. For the week, the DJIA dropped 2.7%, the S&P500 fell 3.1% and the Nasdaq lost 4.5%, the worst week for the tech index since May 2012. After the cash close on Friday, S&P futures saw another spike in volatility around the 1900 mark, rallying 6 handles before falling nearly 10 points in the final minute of index futures trade to close on the lows, portending more volatility in stock trading Monday, when the bond market is closed for Columbus Day. Continue reading “Futures News, Economic Reports & Levels 10.14.2014”

Non Farm Payroll Data, Economic Reports & Levels 10.03.2014

Hello Traders,

For 2014 I would like to wish all of you discipline and patience in your trading!

Hello Traders,


We started a trial for a new squawk box service here at Cannon and I must say I was impressed enough to share with you an example of the wrap up email I received as well as a link to their services:

http://www.livesquawk.com/#!sign_up  Continue reading “Non Farm Payroll Data, Economic Reports & Levels 10.03.2014”

Heikin-Ashi Mini Russell 2000 chart; Economic Reports & Levels 10.02.2014

Hello Traders,

For 2014 I would like to wish all of you discipline and patience in your trading!

Hello Traders,

We started October with a bearish statement on stock indices and being October that may make some bulls even more concerned….Yet it seems that over the past 5 years the bulls were quick to buy any major corrections and following the FED and QE were able to ride the waves up.Well QE is being reduced and job figures may provide the Fed. more confidence to continue with reducing QE. Friday’s monthly reports will be watched closely as well as the X factor – QE in Europe?To be honest I was never much of an in depth fundamental guy as I simply follow too many markets to be an expert on the different fundamentals that move each market, so I try to keep on top of the major news/issues and I rely 80% on charts, especially when it comes to shorter/medium time frames. Continue reading “Heikin-Ashi Mini Russell 2000 chart; Economic Reports & Levels 10.02.2014”