How Discount Brokers Work?

Discount Futures Brokerage is formatted to provide a more cost effective way of trading futures for experienced traders who are comfortable placing trades over the internet , using their personal computer..

Discount Futures Brokers typically offer lower service fees and take a more minimal role in daily trading decisions. What you are essentially using a broker since then, is to place orders and for representation on the exchange floor. It is true that futures trading, or any trading market for that matter, could not operate without market participants and market professionals representing those participants. With commodities markets being so risky, regardless of cost it is clear that qualified brokers are vital to the success of participants of various markets.

What’s The Difference?

The biggest difference with discount brokers is the client’s ability to be more self-directed with their trading profile. The risk associated with futures trading disclaims that there is no guarantee of profit no matter who manages your money. No matter the level of involvement, brokers still represent the interests of every client and are likewise as valuable.  The need for Futures Trading Brokers will never become obsolete, so the emphasis on discount brokerage need be on discounted commissions and fees, not discounted service.

Below is a list of lesser or excluded fees associated with a discount futures brokerage:

  • Account Maintenance Fees
  • Platform Fees
  • DataFeed Fees (Online/E-Trading)
  • Low Margin Investments
  • Broker Support Fees

Another difference with discount brokerage is the type of platform often used for this type of futures brokerage service; online. Online Futures Trading is in some cases synonymous with a discount futures brokerage. The reason this is, is due to lower costs associated with online platforms that allow you to do most of the monitoring of real time market data. A wide selection of online futures companies provide the software you can download to use to trade and build a profile. When one places orders online, he doesn’t need to call his broker and place orders via phone. That saves the time of the broker and allow for lower, discounted fees.

Continue reading “How Discount Brokers Work?”

Mini S&P Chart, Futures Levels and Economic Reports 2.19.2014

Connect with Us! Use Our Futures Trading Levels and Economic Reports RSS Feed.

Like us on FacebookFollow us on TwitterView our profile on LinkedInFind us on Google+Cannon Trading Futures Trading Resistance & Support Levels and Economic ReportsFind us on Yelp

1. Market Commentary
2. Futures Support and Resistance Levels – S&P, Nasdaq, Dow Jones, Russell 2000, Dollar Index
3. Commodities Support and Resistance Levels – Gold, Euro, Crude Oil, T-Bonds
4. Commodities Support and Resistance Levels – Corn, Wheat, Beans, Silver
5. Futures Economic Reports for Wednesday February 19, 2014

Hello Traders,

For 2014 I would like to wish all of you discipline and patience in your trading!

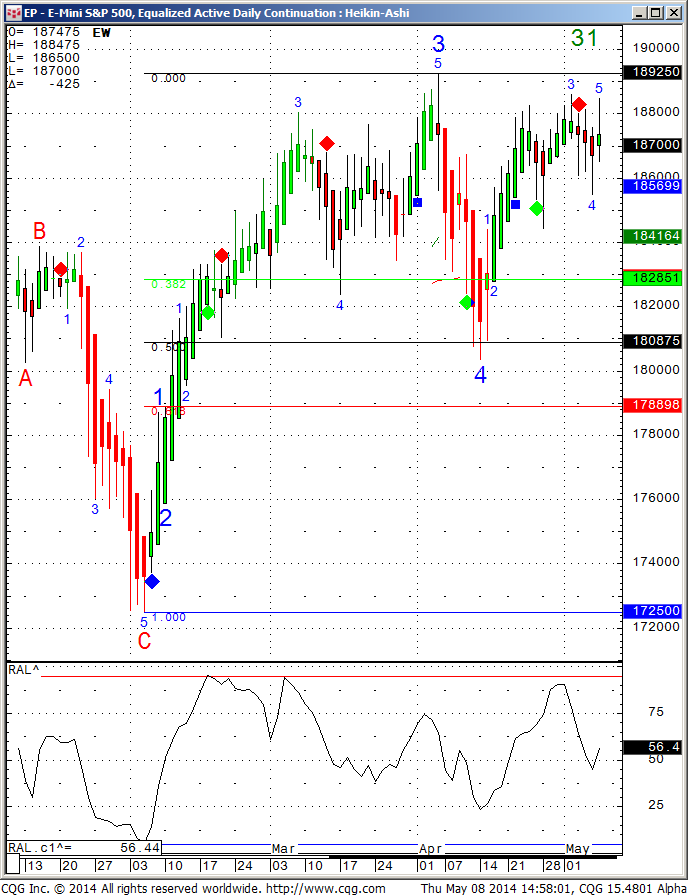
Back after a long weekend and tomorrow we have Fed minutes, which can either provide the market with some power to move to the next level up or perhaps show us that the market ran out of gas….Here is the way my daily SP chart looks like:

EP - E Mini S&P 500, Equalized Active Daily Continuation

President’s Day 2014 – Futures Trading Holiday Schedule

Presidents’ Day Holiday Schedule

All times Central Time

Globex®

Equity Products

Friday, Feb 14

   4:15 CT – Regular close

Sunday, Feb 16

   5:00 CT – Regular open for trade date Tuesday, Feb 18*

Monday, Feb 17

   10:30 CT – Trading halt (pre-open)

   5:00 CT  – Products resume trading

Tuesday, Feb 18

   4:15 CT – Regular close

Interest Rate & FX Products

Friday, Feb 14

   3:15 CT / 1615 ET / 2115 UTC – Early close

Sunday, Feb 16

   5:00 CT – Regular open for trade date Tuesday, Feb 18*

Monday, Feb 17

   12:00 CT – Trading halt (pre- open)

   5:00 CT – Products resume trading

Tuesday, Feb 18

   4:00 CT – Regular close

Energy, Metals & DME Products

Friday, Feb 14

   4:15 CT – Regular close

Sunday, Feb 16

   5:00 CT – Regular open for trade date Tuesday, Feb 18*

Monday, Feb 17

   12:15 CT – Trading halt (pre-open)

   5:00 CT – Products resume trading

Tuesday, Feb 18

   4:15 CT  – Regular close

Grain, Oilseed & MGEX Products

Friday, Feb 14

   Regular close – Per each product schedule

Sunday, Feb 16

   4:00 CT – Pre–open for trade date Tuesday, Feb18*

Monday, Feb 17

   4:00 CT – Open for trade date Tuesday, Feb 18

Tuesday, Feb 18

   Regular close – Per each product schedule

Livestock, Dairy & Lumber Products

Friday, Feb 14

   Regular close – Per each product schedule for:

  • Livestock
  • Dairy
  • Lumber

Monday, Feb 17

   5:00 CT – Dairy markets open for trade date Tuesday, Feb 18

Tuesday, Feb 18

   9:00 CT – Lumber market open

   9:05 CT – Livestock markets open

Regular close – Per each product schedule

* Note: Session orders entered on Sunday are for trade date Tuesday, Feb 18 and will continue working until Tuesday’s close unless otherwise noted.


*Dates and times are subject to change

For a complete list of Globex schedules please reference the Excel version of the Holiday calendar: http://www.cmegroup.com/tools-information/holiday-calendar/files/2014-presidents-day-holiday-schedule.xls

If you have any questions, please call the CMEGlobalCommandCenter at +1 800 438 8616call skype logo+1 800 438 8616, in Europe

at +44 800 898 013call skype logo+44 800 898 013 or in Asia at +65 6532 5010call skype logo+65 6532 5010

Intercontinental Exchange / ICE

Friday, Feb 14

All ICE U.S. products

   Regular close – Per each product schedule

Monday, Feb 17

ICE Futures US Soft’s including US Grains and Oilseeds

   CLOSED

USDX INDEX & FOREX:

   Early close 12:00 P.M. CT and no TAS trading

Russell Index:

   Early close 10:30 A.M. CT and no TAS nor TIC trading

Credit Index Futures:

   Early Close 10:30 A.M. CT and no TAS trading

For a complete list of ICE schedules please reference the Holiday calendar on the ICE web site:

https://www.theice.com/marketdata/Calendar.shtml?calendars=Holiday&expirationEnabled=false&calendars=SpecialTradingHours

The above sources were compiled from sources believed to be reliable.  Cannon Trading assumes no responsibility for any errors or omissions.  It is meant as an alert to events that may affect trading strategies and is not necessarily complete.  The closing times for certain contracts may have been rescheduled.

Futures & Commodities Levels and Economic Reports 2.13.2014

Connect with Us! Use Our Futures Trading Levels and Economic Reports RSS Feed.

Like us on FacebookFollow us on TwitterView our profile on LinkedInFind us on Google+Cannon Trading Futures Trading Resistance & Support Levels and Economic ReportsFind us on Yelp

1. Market Commentary
2. Futures Support and Resistance Levels – S&P, Nasdaq, Dow Jones, Russell 2000, Dollar Index
3. Commodities Support and Resistance Levels – Gold, Euro, Crude Oil, T-Bonds
4. Commodities Support and Resistance Levels – Corn, Wheat, Beans, Silver
5. Futures Economic Reports for Thursday February 13, 2014

Hello Traders,

For 2014 I would like to wish all of you discipline and patience in your trading!

If you are a stock index futures trader, like many of our readers/clients are, try and pay attention to how the 30 year bonds move intraday.
I have found out that many days you can see the inverse relationship between the bonds and stocks, especially on days when there is not much news or range bound days like today.
Sometimes I noticed that if bonds start bidding higher it can serve as a small signal for possible sell off in SP500 and other stock indices and vice versa.
Obviously I would NOT use this as the sole tool for making trading decisions but follow the price action for a while as well as the relationship between stock index futures and interest rate futures and see if this can be helpful for you with your trading.

Crude Oil and Gold Futures Chart, Futures Levels and Economic Reports 2.12.2013

Connect with Us! Use Our Futures Trading Levels and Economic Reports RSS Feed.

Like us on FacebookFollow us on TwitterView our profile on LinkedInFind us on Google+Cannon Trading Futures Trading Resistance & Support Levels and Economic ReportsFind us on Yelp

1. Market Commentary
2. Futures Support and Resistance Levels – S&P, Nasdaq, Dow Jones, Russell 2000, Dollar Index
3. Commodities Support and Resistance Levels – Gold, Euro, Crude Oil, T-Bonds
4. Commodities Support and Resistance Levels – Corn, Wheat, Beans, Silver
5. Futures Economic Reports for Wednesday February 12, 2014

Hello Traders,

For 2014 I would like to wish all of you discipline and patience in your trading!


Trader Planet


Voted Best Blog 2013 by Trader Planet

Thanks everyone who voted!! Appreciate your help in winning the #1 blog for futures trading by Trader Planet!! Please feel free to forward our daily blog to friends and other fellow traders who might be interested.

Another two markets I like to touch on when it comes to “other markets to daytrade beside the mini SP 500” are crude Oil and Gold futures.

More than a few similarities between the two markets.

They are both volatile, can move VERY fast. I have seen some very large moves happen in matter of minutes if not seconds. The “fear & greed” factor really plays a role in these specific two markets.

Both have active trading hours starting with Far East trading around 10 PM est all the way to the next morning until about 3 PM est. Good volume generally speaking but not close to the mini SP or ten year notes. So you may see some slippage on stops but the volume is more than enough to trade size.

Each tick on gold is $10, so every dollar move =$100 against you or in your favor. Crude is similar, each tick = $10. One full $1 move = $1000.

Both markets were quiet today relatively speaking but even on a quiet day, the range on gold was  $21 or = $2100 wide using one futures contract. Crude ranges today was less than $1 or about $890 between hi/lo.

I like using overbought/ oversold indicators on the two markets as well as using range / Renko charts.

If you never traded these markets before, I highly recommend exploring in simulation/ demo mode. get a feel for the explosiveness, volatility, personality for a few weeks before trying in live mode.

As always, any questions, please feel free to email me.

Two charts from today’s session of gold and crude for your review below ( if you like to try the charts I am using along with indicators displayed, send me an email):


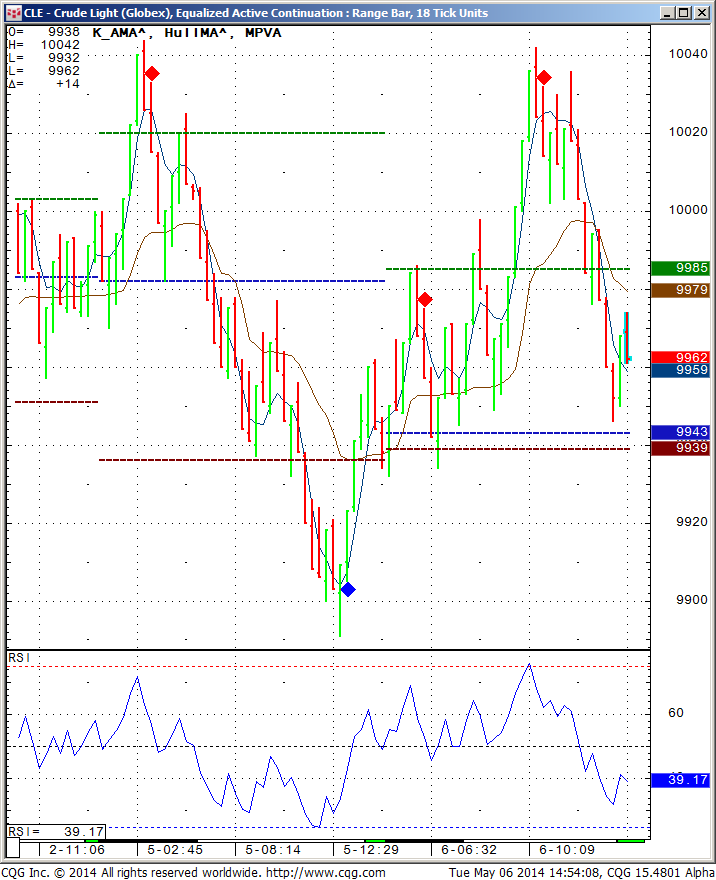
Crude 18 ticks range bar Feb. 11th 2014

CLE - Crude Lights (Globex), Equalized Active Continuation - Range Bar 18 Ticks Units

Gold, 36 ticks range bar Feb. 11th 2014


GCE - Gold (Globex), Equalized Active Continuation - Range Bar =, 18 Ticks Units
GCE – Gold (Globex), Equalized Active Continuation – Range Bar =, 18 Ticks Units

Continue reading “Crude Oil and Gold Futures Chart, Futures Levels and Economic Reports 2.12.2013”

Futures Levels & Economic Reports 2.11.2014

Connect with Us! Use Our Futures Trading Levels and Economic Reports RSS Feed.

Like us on FacebookFollow us on TwitterView our profile on LinkedInFind us on Google+Cannon Trading Futures Trading Resistance & Support Levels and Economic ReportsFind us on Yelp

1. Market Commentary
2. Futures Support and Resistance Levels – S&P, Nasdaq, Dow Jones, Russell 2000, Dollar Index
3. Commodities Support and Resistance Levels – Gold, Euro, Crude Oil, T-Bonds
4. Commodities Support and Resistance Levels – Corn, Wheat, Beans, Silver
5. Futures Economic Reports for Tuesday February 11, 2014

Hello Traders,

For 2014 I would like to wish all of you discipline and patience in your trading!

RECAP OF LAST WEEK AND A PEAK AHEAD INTO THIS WEEKS TRADING BY TRADETHENEWS.COM

TradeTheNews.com Weekly Market Update: The Correction Corrects

Fri, 07 Feb 2014 16:09 PM EST- The week began with a massive sell-off, as the DJIA and S&P500 fell more than 2% a piece on Monday and closed at their lows, while the DJIA also fell below its 200-day moving average for the first time since October. The declines came after a bad slide on the prior Friday and were exacerbated by another discouraging Chinese PMI reading. On Tuesday, the Nikkei saw a 4% slump, but global markets bottomed out mid-week and then recouped all of their losses. In Europe, healthy-looking PMI data helped limit losses, while the mixed US jobs report did not damage the bounce-back on Friday. Emerging market currencies stabilized this week following the recent round of rate hikes. For the week, the DJIA rose 0.6%, the S&P500 gained 0.8% and the Nasdaq added 0.5%.- The January US non-farm payrolls figure widely missed expectations and the December figure was revised higher by a mere 1K, making for the weakest two-month period of job growth in three years. However, investors are looking past this to find some pretty good news in the numbers. The lack of upward revisions in December data was still blamed on harsh weather, and the November payroll gains were revised higher again to 274K from 241K. More significantly, unemployment rate fell again to 6.6% while the labor force participation rate edged up to 63%, and employment measured by the household survey increased by 616K, complemented by a huge decline in part-time employment.

– Janet Yellen was officially sworn in as the new Fed chairman this week. Nearly everyone expects a pretty smooth transition, with Yellen very unlikely to make any changes to the course charted by helicopter Ben. She will have to deal with policy contradictions now that unemployment is nearly at the Fed’s 6.5% threshold while job growth remains anemic. At the December meeting, the Fed extended its forward guidance by stressing that low rates will likely remain appropriate “well past” reaching the 6.5% threshold, however market rates are still creeping higher. Next week will see Yellen’s first big policy statement, during Congressional testimony on the economic outlook and monetary policy. Several Fed officials this week, both hawks and doves, affirmed that tapering was still on track and that it would take a significant change in the data to force them the reconsider it.

– Despite the week-long Lunar New Year holiday on the mainland, China released the official PMI figures for the month of January on Monday. Much like the disappointing HSBC final PMI readings, the government figures described more deterioration with manufacturing PMI falling to 50.5, a six-month low, and non-manufacturing falling to 53.4, a 23-month low. Perhaps most notable among components, the employment reading in the manufacturing sector fell to an 11-month low. Meanwhile, the China Commence Ministry reported 2014 Lunar New Year “golden week” retail sales that were up a mere +13.3% y/y, the slowest pace of growth on record for the key holiday retail period.

– Shares of Twitter were down as much as 24% on Wednesday after the firm released its first quarterly report as a publically traded company. Twitter’s headline EPS and revenue numbers were much better than expected, but traders and analysts insist that slowing user growth and weaker engagement trends seen in metrics bode ill for the firm. In addition, the first round of lock-up expirations arrives on February 15th, followed by another round on May 7th. Cult tech names Pandora and LinkedIn saw losses as well in the wake of problematic quarterly results. Both firms disclosed decent fourth-quarter results but offered guidance that widely missed consensus estimates.

– Time Warner reported strong fourth-quarter results. Analysts focused on the company’s decision to break out separate HBO revenue figures for the first time. HBO took in $1.26B compared to $1.19B y/y, citing the consolidation of Asia and certain European operations for the 4% gain. This compares to Netflix’s $1.18B in revenue in the quarter.

– On Thursday, Apple disclosed that it has repurchased $14B in common stock over the last two weeks, amounting to 3.1% of its market cap. Over the last 12 months, the company said it has bought back $40B in stock, an all-time record for Apple or any company. CEO Cook said that the company had been surprised by the 8% decline on Jan 28th that came after reporting quarterly results. He also pledged to return $100B to shareholders by the end of 2015.

Continue reading “Futures Levels & Economic Reports 2.11.2014”

Futures Currencies, Futures Levels & Economic Reports for 2.07.2014

Connect with Us! Use Our Futures Trading Levels and Economic Reports RSS Feed.

Like us on FacebookFollow us on TwitterView our profile on LinkedInFind us on Google+Cannon Trading Futures Trading Resistance & Support Levels and Economic ReportsFind us on Yelp

1. Market Commentary
2. Futures Support and Resistance Levels – S&P, Nasdaq, Dow Jones, Russell 2000, Dollar Index
3. Commodities Support and Resistance Levels – Gold, Euro, Crude Oil, T-Bonds
4. Commodities Support and Resistance Levels – Corn, Wheat, Beans, Silver
5. Futures Economic Reports for Friday February 7, 2014

Hello Traders,

For 2014 I would like to wish all of you discipline and patience in your trading!

There is more to daytrading than e-minis….:

Few days ago I touched on the financial sector, mostly bonds and ten years. Today I would like to talk a little about the currency futures markets. I personally prefer currency futures over FOREX any day. More than a few reasons but the main ones are: currency futures trade on one, regulated main exchange ( CME) while FOREX trades through different interbanks and other means of transactions that are not necessarily regulated. FOREX are “commission free” but in reality there is a spread built in that dealer marks up each time you buy or sell which makes FOREX more expensive than futures.

The main ones I like to follow are:

The Euro , The Yen, The British Pound, The Australian. All are paired versus the US$.

Each market will have different times of higher volume which can allow for traders in all time zones to pick their market. Simply open an hourly chart, like the example i am showing below of the Australian $ and add the volume indicator to observe what times the market has the most action.

  • 1 Euro tick is $12.50
  • 1 Yen tick is $12.50
  • 1 Aussie tick is $10
  • 1 British tick is $6.25

Currency futures will often trend better than other segments and will experience different levels of volatility during economic reports in the different parts of the world.

If you plan on following any currencies, start in demo mode, know what reports are coming that affect the specific currency you are trading, take a look at the daily, weekly charts to get a feel and monitor the action for a while.

Any questions and i will be happy to assist.


DA 6 - Australian Dollar (Globex), Equalized Active 60 Min Continuation
DA 6 – Australian Dollar (Globex), Equalized Active 60 Min Continuation

Continue reading “Futures Currencies, Futures Levels & Economic Reports for 2.07.2014”

VIX, Futures Levels & Economic Reports 2-06-2014

Connect with Us! Use Our Futures Trading Levels and Economic Reports RSS Feed.

Like us on FacebookFollow us on TwitterView our profile on LinkedInFind us on Google+Cannon Trading Futures Trading Resistance & Support Levels and Economic ReportsFind us on Yelp

1. Market Commentary
2. Futures Support and Resistance Levels – S&P, Nasdaq, Dow Jones, Russell 2000, Dollar Index
3. Commodities Support and Resistance Levels – Gold, Euro, Crude Oil, T-Bonds
4. Commodities Support and Resistance Levels – Corn, Wheat, Beans, Silver
5. Futures Economic Reports for Thursday February 6, 2014

Hello Traders,

For 2014 I would like to wish all of you discipline and patience in your trading!

The CBOE Volatility Index (VIX) Futures Now Available.

Effective February 3, 2014: The VIX futures contract has been added to E-Futures Int’l trading platform

.The contract symbol is VX and trading hours, margin requirement, and contract specification information is available at:

https://www.cannontrading.com/tools/contract-specifications

According to CFE, trading volume in VIX futures totaled 39.9 million contracts for 2013, a fourth straight annual volume record, and surpassing the 23.8 million contracts traded in 2012 by 68 percent. Average daily volume in VIX futures was 158,508 contracts, also a fourth consecutive annual record, and up 67 percent from 2012.

Note:

The CFE exchange does not allow trials. All products are available in the development and live trading environments but are not accessible for demo trading in the simulated environment

Continue reading “VIX, Futures Levels & Economic Reports 2-06-2014”

Futures Levels & Economic Reports 2.04.2014

Connect with Us! Use Our Futures Trading Levels and Economic Reports RSS Feed.

Like us on FacebookFollow us on TwitterView our profile on LinkedInFind us on Google+Cannon Trading Futures Trading Resistance & Support Levels and Economic ReportsFind us on Yelp

1. Market Commentary
2. Futures Support and Resistance Levels – S&P, Nasdaq, Dow Jones, Russell 2000, Dollar Index
3. Commodities Support and Resistance Levels – Gold, Euro, Crude Oil, T-Bonds
4. Commodities Support and Resistance Levels – Corn, Wheat, Beans, Silver
5. Futures Economic Reports for Tuesday February 4, 2014

Hello Traders,

For 2014 I would like to wish all of you discipline and patience in your trading!

TradeTheNews.com Weekly Market Update: As January Goes…

Fri, 31 Jan 2014 16:12 PM EST- Global equity markets saw even more turbulence this week, although the equity declines were more muted overall. The final week of January saw the Federal Reserve taper asset purchases for a second consecutive meeting, reducing the pace of monthly buys by $10 billion to $65 billion, split equally between US treasuries and MBS. There was little change in the Fed’s language and no press conference, but the absence of any commentary on the emerging market currency rout was unsettling for some. Three of the “fragile five” nations (Brazil, India, Indonesia, Turkey, and South Africa) raised interest rates in an attempt to stem capital flight and bolster currencies, but the sense is that the emerging market situation will only be getting worse. US GDP and inflation data were pretty solid, while European unemployment and inflation data was anything but, which pummeled the euro and drove key UST-Bund spreads to their widest levels in six months. For the week, the DJIA dropped 1.1%, the S&P500 lost 0.4% and the Nasdaq declined 0.6%, leaving all three major indices down low-single digit percentages for the opening month of 2014.- US advance fourth quarter GDP met expectations at +3.2% and the personal consumption expenditures component hit its highest growth rate since 2010. Recall that the Q3 final GDP figure was +4.1%; the Commerce Department said that the deceleration reflected lower nonresidential investment, a larger decrease in federal spending and weaker PCE and exports. It was estimated that the government shutdown subtracted 0.3% from the Q4 headline GDP growth, while Federal spending fell 12.6% y/y in the quarter, pushing total government spending down 4.9% y/y. Some analysts speculated that in the absence of Federal austerity measures, GDP would have been above 4%.- The Fed’s favored measure of inflation inched higher in December. The core PCE price index rose 0.1% from a month earlier, bringing the y/y core inflation rate to 1.2% from 1.1%. The core measure remains well short of the Fed’s 2.0% inflation target. Contrast the US data with the Eurozone flash January CPI reading: headline inflation was 0.7%, matching the four-year low seen in October. The German state CPIs for January all sank lower. The ECB has vocally dismissed arguments that Europe is facing deflation, however the bank cut rates by 25 bps to 0.25% in the wake of the October CPI report. The next ECB rate decision will be on Thursday, and many analysts are now forecasting another 15-20 bps rate cut. Recall that after the bank’s last decision, President Draghi stated two contingencies would force the ECB to act: a worsening inflation outlook or unwarranted money market tightening. In the wake of the two inflation reports, the US-German 2-year spread hit six-month highs, at a little more than 26 bps. EUR/USD dropped below the 1.3500 level for the first time in two months.- Three emerging market central banks boosted interest rates this week in attempts to grapple with the volatility seen in currency markets. India hiked its base rate by 25 bps to 8.00%, Turkey raised its overnight lending rate by a huge 425 bps to 12.00% and the South Africa Central Bank raised its key rate by 50 bps to 5.50%. The moves have limited the decay of the three nations’ currencies for now, but they have hardly reversed the ugly trend. USD/INR remains just shy of the 63.5 high seen before the decision. The Turkish Lira had spiked to a fresh all-time low of nearly 2.40 to the dollar and dropped to 2.16 after the decision, but weakened back to the 2.25 area in the second half of the week. The South Africa Rand got close to all-time lows, hitting 11.36 to the greenback before the decision, and has only strengthened slightly after the rate hike.

– Industrial names Boeing, Ford, and Caterpillar offered decent but not excellent results for the December quarter. Cat’s Q4 earnings and revenue totals widely topped expectations, with profits higher y/y but revenue down 10% from last year’s Q4. The firm’s initial FY14 earnings outlook was also very good, although executives cautioned that the mining industry would remain weak in the near term. At first glance, Ford’s earnings crushed the consensus view, but before a big tax benefit profits fell nearly 25% y/y. Likewise Boeing’s EPS blew out expectations, but only because of a very low corporate tax rate. Ford warned that the launch of a big range of new models, including the new aluminum body F-150, would hold back North America earnings in FY14. Boeing’s guidance for commercial deliveries around 715-725 planes indicates another year of growth for the firm.

Continue reading “Futures Levels & Economic Reports 2.04.2014”