FOMC Sparks True Futures Market Reaction, November 4th 2010

FOMC came and gone. market had its normal volatile two sided action but finished on the highs.

I have said this before, many times you can see the “true market reaction” the day after FOMC.

Tomorrow and Friday (monthly un-employment figures) should be interesting and perhaps volatile trading days. Continue reading “FOMC Sparks True Futures Market Reaction, November 4th 2010”

Volatile Moves Expected Following Election Results from Futures Trading Market on November 3rd 2010

A BIG 24 hours lay ahead….I suspect some volatility to hit the night markets as election results come out and then we jump right into FOMC tomorrow.

FOMC tomrrow around 2:15 Eastern time.

FOMC days have different characteristics than other trading days. If you have traded for a while, check your trading notes from past FOMC days that may help you prepare for tomorrow.

if you’re a newcomer, take a more conservative approach and make sure you understand that the news can really move the market.

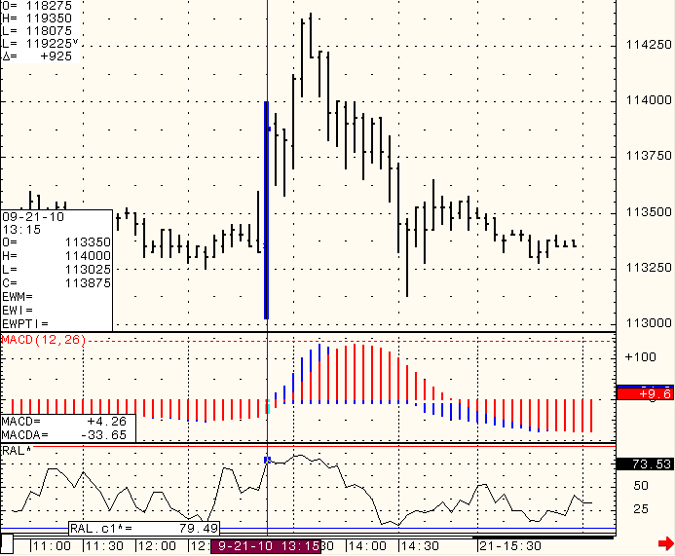
My observations suggest choppy, low volume up until announcement, followed by some sharp volatile moves right during and after the announcement.

I am including a five-minutes chart from Sept. 21st of this year, which was the last FOMC we had for your reference.

SP-500-Day-Trading-2010-11-03 Continue reading “Volatile Moves Expected Following Election Results from Futures Trading Market on November 3rd 2010”

Daily Futures Day Trading Webinar and Futures Trading Levels for November 2nd 2010

Two day FOMC starts tomorrow along with preliminary election news. Should provide for some interesting action in the second part of the trading week.

In between I still don’t see a longer term or a medium term swing trading set up I like, hence I currently focus on intraday set ups which I share in my daily “live charts/ webinar” service.

Daily Futures Day Trading Webinar:
**************************************************
https://www.cannontrading.com/tools/intraday-futures-trading-signals
**************************************************

Continue reading “Daily Futures Day Trading Webinar and Futures Trading Levels for November 2nd 2010”

Futures Trading Levels and Day Trading Webinar Trial, October 27th 2010

Stocks finished pretty much unchanged today, which brings me to another point….

There ARE OTHER MARKETS one can day-trade….Most day-traders focus on the Mini SP 500 and it’s relatives:
Mini Nasdaq, Mini Dow, Mini Russell etc. because of volume, familiarity, trading hours etc.

However, markets like bonds, Euro Currency, Crude oil, beans, corn to name a few do offer day trading opportunities and risks. Different market have different personalities which may fit different traders. Different markets also have different trading hours when volatility is present, different volatility at different times and other

characteristics which traders may want to explore. During the day-trading charts service I hold daily, I feature the mini SP 500 chart along with Euro currency and Crude oil and possible trade set ups.

As always I recommend using demo account when exploring trading in market you normally don’t trade, as well as performing some research regarding tick size, price behavior and more.

FREE Trial for the Day-Trading Charts Service:
*************************************************************
https://www.cannontrading.com/tools/intraday-futures-trading-signals
************************************************************* Continue reading “Futures Trading Levels and Day Trading Webinar Trial, October 27th 2010”
Futures Trading Market Levels for October 20th 2010

The 23rd anniversary of the 1987 crash was today and respectively, market finished down about 1.3%…..

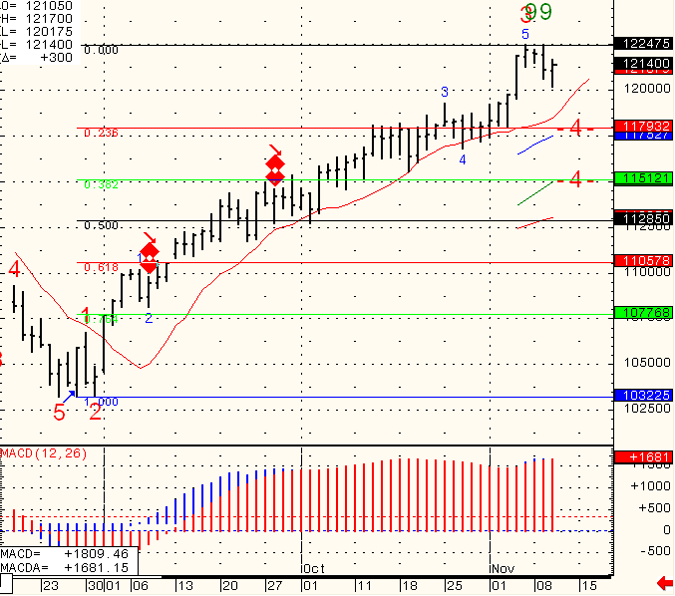
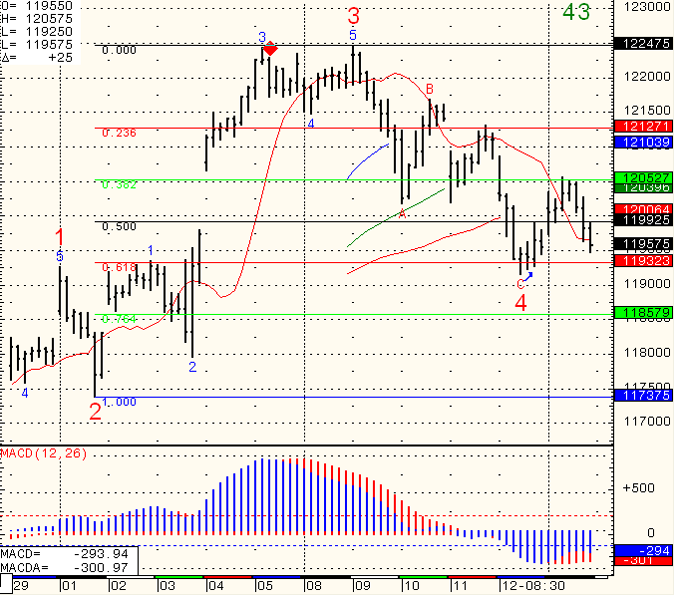
Daily chart of the mini NASDAQ 100 for your review below. If the sell signal materializes, first target will be around 2019.00.

SP-500-Day-Trading-2010-10-20 Continue reading “Futures Trading Market Levels for October 20th 2010”

Free Day Trading Webinar Trial, October 18th 2010

Have a great weekend!! take time to clear your “trading brain” and allow it to recharge.

Screen shot from today’s session during our “live charts” service where one can see real-time trade set ups like below
(blue diamonds = possible buy, red diamonds = possible sell)

Charts included in this service are: Mini SP 500, Euro Currency and Crude oil.

For a Free Day Trading Webinar Trial Please Visit:
**************************************************************
https://www.cannontrading.com/tools/intraday-futures-trading-signals
**************************************************************

Continue reading “Free Day Trading Webinar Trial, October 18th 2010”

Futures Trading Levels & Economic Reports for October 14th 2010

The FED keeps pumping money through its “Quantitative Easing” and the market continues to bounce higher.

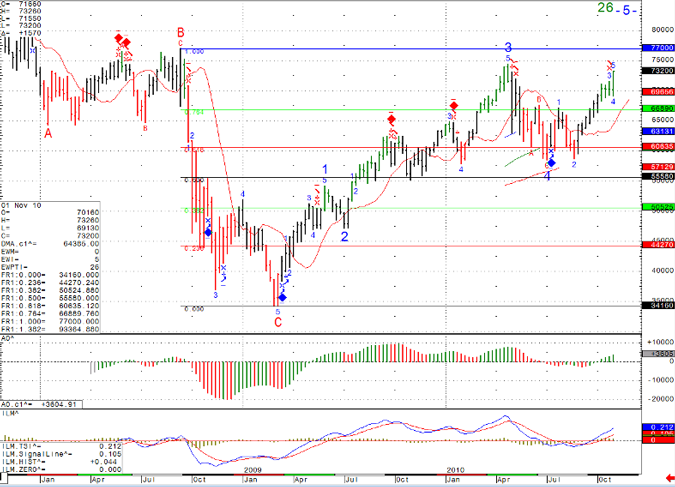
Not sure how long this “game” will continue but a technical overview of the mini Russell (which I feel is the leader amongst indicies) is below for your information.

SP 500 Day Trading
SP 500 Day Trading

Continue reading “Futures Trading Levels & Economic Reports for October 14th 2010”

Daily Support & Resistance and Economic Data to be Released, October 13th 2010


Daily Support & Résistance Levels Mini-S&P 500 Futures
Dec. 10
Mini-Nasdaq 100 Futures
Dec. 10
Mini-Dow Futures
Dec. 10
Mini Russell 2000 Futures
Dec.10
30-year US Bond Futures
Dec. 10
10-Year US Note
Futures Dec. 10
Support 3 1151.00 2009.00 10843 681.70 13117 12528
Support 2 1156.50 2020.00 10891 686.10 13209 12616
Support 1 1162.75 2032.00 10946 691.00 13300 12626
Resistance 1 1174.75 2058.75 11044 700.30 13314 12703
Resistance 2 1181.50 2063.00 11115 706.60 13403 12707.5
Resistance 3 1188.25 2083.00 11139 719.70 13412 12711
Daily Support & Resistance Levels
Gold Futures
Dec.2010
Silver Futures
Dec. 2010
Copper Futures
Dec. 2010
Crude Oil Futures
Nov. 2010
Euro Curr.
Dec. 2010
Dollar Index
Dec. 2010
Support 3 1339.0 22.85 3.750 80.88 1.3768 .7629
Support 2 1348.0 23.16 3.771 81.69 1.3857 .7705
Support 1 1353.0 23.34 3.795 82.47 1.3912 .7717
Resistance 1 1366.0 23.68 3.841 82.99 1.4001 .7754
Resistance 2 1375.0 23.81 3.860 83.50 1.4026 .7766
Resistance 3 1391.0 24.09 3.880 84.43 1.4113 .7778

Updated: 13-Oct-10 08:32 ET

This Week’s Calendar

Click on a “Release” for Insight

Date ET Release For Actual Briefing.com Consensus Prior Revised From
Oct 13 07:00 MBA Mortgage Applications 10/08 NA NA -0.2%
Oct 13 08:30 Export Prices ex-ag. Sep NA NA 0.5%
Oct 13 08:30 Import Prices ex-oil Sep NA NA 0.3%
Oct 13 14:00 Treasury Budget Sep -$32.0B -$33.5B -$46.6B
Oct 14 8:30 Initial Claims 10/09 450K 450K 445K
Oct 14 8:30 Continuing Claims 10/02 4450K 4450K 4462K
Oct 14 08:30 PPI Sep 0.1% 0.2% 0.4%
Oct 14 08:30 Core PPI Sep 0.1% 0.1% 0.1%
Oct 14 08:30 Trade Balance Aug -$40.0B -$44.5B -$42.8B
Oct 14 11:00 Crude Inventories 10/09 NA NA 3.09M
Oct 15 08:30 CPI Sep 0.1% 0.2% 0.3%
Oct 15 08:30 Core CPI Sep 0.1% 0.1% 0.1%
Oct 15 08:30 Retail Sales Sep 0.2% 0.4% 0.4%
Oct 15 08:30 Retail Sales ex-auto Sep 0.1% 0.4% 0.6%
Oct 15 08:30 NY Fed – Empire Manufacturing Survey Oct 3.0 5.75 4.10
Oct 15 09:55 Mich Sentiment Oct 67.0 68.5 68.2
Oct 15 10:00 Business Inventories Aug 0.4% 0.5% 1.0%

SEE FULL LIST HERE

13. OCT. 2010    Today´s Highlighted Splits

SYMBOL COMPANY EVENT TITLE EPS ESTIMATE EPS ACTUAL PREV. YEAR ACTIVITY DATE/TIME (ET)
HST Host Hotels & Resorts Inc. Q3 2010 Host Hotels & Resorts Inc. Earnings Release $ 0.11 n/a $ 0.11 13-Oct BMO
JPM JPMorgan Chase & Co. Q3 2010 JPMorgan Chase & Co. Earnings Release $ 0.90 n/a $ 0.82 13-Oct 7:00 AM
APOL Apollo Group Q4 2010 Apollo Group Earnings Release $ 1.30 n/a $ 1.06 13-Oct AMC
ACGY Acergy S.A. Q3 2010 Acergy S.A. Earnings Release $ 0.28 n/a $ 0.29 13-Oct
MTOX MEDTOX Scientific, Inc. Q3 2010 MEDTOX Scientific, Inc. Earnings Release $ 0.13 n/a $ 0.09 13-Oct 6:00 AM
TESS TESSCO Q2 2011 TESSCO Earnings Release $ 0.44 n/a $ 0.51 13-Oct AMC

Continue reading “Daily Support & Resistance and Economic Data to be Released, October 13th 2010”