Managing Your Futures Trading/Position 3.15.2016

Connect with Us! Use Our Futures Trading Levels and Economic Reports RSS Feed.

Like us on FacebookFollow us on TwitterView our profile on LinkedInFind us on Google+Cannon Trading Futures Trading Resistance & Support Levels and Economic ReportsFind us on Yelp

1. Market Commentary
2. Futures Support and Resistance Levels – S&P, Nasdaq, Dow Jones, Russell 2000, Dollar Index
3. Commodities Support and Resistance Levels – Gold, Euro, Crude Oil, T-Bonds
4. Commodities Support and Resistance Levels – Corn, Wheat, Beans, Silver
5. Futures Economic Reports for Tuesday March 15, 2016

Hello Traders,

For 2016 I would like to wish all of you discipline and patience in your trading!

Greetings! 

FRONT MONTH for STOCK INDEX is JUNE!!

A note on managing trade size by my colleague, John Thorpe who has over 25 years of experience starting on the floor of the CBOT.

Managing your trading/position size is crucial to long term success regardless of style.

Daytrading, Swing or long term position trading.

In order to select the size you will employ make a mental note of three things before you trade.  The Foundation of Trading your plan is first determining the size you will be employing, the number of contracts.

We must assume your risk capital is fixed.

1)  How liquid is the contract I will be trading?

Are there frequent price gaps, lack of continuity with bid/ask spreads.

What is the Open Interest and Volume relative to other contracts in the same industry, index , futures contract type.

Continue reading “Managing Your Futures Trading/Position 3.15.2016”

Rollover Notice for Stock Index Futures 3.10.2016

Connect with Us! Use Our Futures Trading Levels and Economic Reports RSS Feed.

Like us on FacebookFollow us on TwitterView our profile on LinkedInFind us on Google+Cannon Trading Futures Trading Resistance & Support Levels and Economic ReportsFind us on Yelp

1. Market Commentary
2. Futures Support and Resistance Levels – S&P, Nasdaq, Dow Jones, Russell 2000, Dollar Index
3. Commodities Support and Resistance Levels – Gold, Euro, Crude Oil, T-Bonds
4. Commodities Support and Resistance Levels – Corn, Wheat, Beans, Silver
5. Futures Economic Reports for Thursday March 10, 2016

Hello Traders,

For 2016 I would like to wish all of you discipline and patience in your trading!

Greetings! 

I personally will start trading the June mini SP this Friday but most traders will rollover tomorrow: 

Rollover Notice for Stock Index Futures

Important notice: For those of you trading any stock index futures contracts, i.e., the E-mini S&P, E-mini NASDAQ, E-mini Dow Jones, the “Big” pit-traded S&P 500, etc., it is extremely important to remember that tomorrow, Thursday, March 10th, at 8:30 am CDT  Time is rollover day.

Starting March 10th, the June 2016 futures contracts will be the front month contracts. It is recommended that all new positions be placed in the June 2016 contract as of March 10th. Volume in the March 2016 contracts will begin to drop off until its expiration on Friday March 18th.

The month code for June is M6.

Traders with electronic trading software should make sure that defaults reflect the proper contract as of Thursday morning.

Please close any open March Currency positions by the close on Friday the 11th.

Should you have any further question please contact your broker.

Continue reading “Rollover Notice for Stock Index Futures 3.10.2016”

The Power of Diversification When Trading 3.08.2016

Connect with Us! Use Our Futures Trading Levels and Economic Reports RSS Feed.

Like us on FacebookFollow us on TwitterView our profile on LinkedInFind us on Google+Cannon Trading Futures Trading Resistance & Support Levels and Economic ReportsFind us on Yelp

1. Market Commentary
2. Futures Support and Resistance Levels – S&P, Nasdaq, Dow Jones, Russell 2000, Dollar Index
3. Commodities Support and Resistance Levels – Gold, Euro, Crude Oil, T-Bonds
4. Commodities Support and Resistance Levels – Corn, Wheat, Beans, Silver
5. Futures Economic Reports for Tuesday March 8, 2016

Hello Traders,

For 2016 I would like to wish all of you discipline and patience in your trading!

Greetings!

The Power of Diversification When Trading

I believe that if you are only trading (daytrading) one market you may be missing out on diversifying yourself by trading other markets.

Just like if you have a portfolio that is not diversified, you expose yourself to more risk, I think the same holds with futures.

I like to daytrade at least 3 markets or at least follow 3 markets and see which ones offers set ups that I like. If you only trade the ES, you will have many days during the year where there is lower volatility, tight ranges and perhaps just “dead days”. However if you are also following bonds and crude oil you have better chances to get in trade set ups that you prefer. Not only that there are times that one trade will make up for another one that is not going so well etc.

Continue reading “The Power of Diversification When Trading 3.08.2016”

Gold Futures Heikin-Ashi Chart 3.03.2016

Connect with Us! Use Our Futures Trading Levels and Economic Reports RSS Feed.

Like us on FacebookFollow us on TwitterView our profile on LinkedInFind us on Google+Cannon Trading Futures Trading Resistance & Support Levels and Economic ReportsFind us on Yelp

1. Market Commentary
2. Futures Support and Resistance Levels – S&P, Nasdaq, Dow Jones, Russell 2000, Dollar Index
3. Commodities Support and Resistance Levels – Gold, Euro, Crude Oil, T-Bonds
4. Commodities Support and Resistance Levels – Corn, Wheat, Beans, Silver
5. Futures Economic Reports for Friday March 4, 2016

Hello Traders,

For 2016 I would like to wish all of you discipline and patience in your trading!

Greetings!

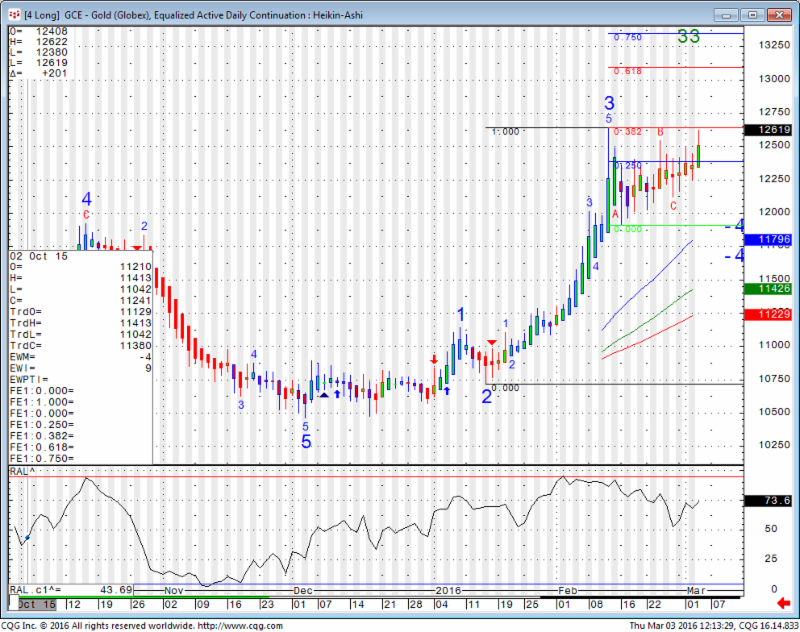
Daily chart of the Gold futures for your review. Heikin-Ashi chart type.

We are trading against first major resistance since this bounce started and tomorrow is monthly unemployment!! Could be a volatile day:

Gold Futures Heikin-Ashi Chart March 3rd, 2016

Continue reading “Gold Futures Heikin-Ashi Chart 3.03.2016”

Mini S&P Heikin-Ashi 3.03.2016

Connect with Us! Use Our Futures Trading Levels and Economic Reports RSS Feed.

Like us on FacebookFollow us on TwitterView our profile on LinkedInFind us on Google+Cannon Trading Futures Trading Resistance & Support Levels and Economic ReportsFind us on Yelp

1. Market Commentary
2. Futures Support and Resistance Levels – S&P, Nasdaq, Dow Jones, Russell 2000, Dollar Index
3. Commodities Support and Resistance Levels – Gold, Euro, Crude Oil, T-Bonds
4. Commodities Support and Resistance Levels – Corn, Wheat, Beans, Silver
5. Futures Economic Reports for Thursday March 3, 2016

Hello Traders,

For 2016 I would like to wish all of you discipline and patience in your trading!

Greetings!

Daily chart of the mini SP 500 for your review. Heikin-Ashi chart type.

We are trading against first major resistance since this bounce started:

Mini S&P Heikin-Ashi March 3rd, 2016

Continue reading “Mini S&P Heikin-Ashi 3.03.2016”

Keeping A Futures Trading Journal 3.02.2016

Connect with Us! Use Our Futures Trading Levels and Economic Reports RSS Feed.

Like us on FacebookFollow us on TwitterView our profile on LinkedInFind us on Google+Cannon Trading Futures Trading Resistance & Support Levels and Economic ReportsFind us on Yelp

1. Market Commentary
2. Futures Support and Resistance Levels – S&P, Nasdaq, Dow Jones, Russell 2000, Dollar Index
3. Commodities Support and Resistance Levels – Gold, Euro, Crude Oil, T-Bonds
4. Commodities Support and Resistance Levels – Corn, Wheat, Beans, Silver
5. Futures Economic Reports for Wednesday March 2, 2016

Hello Traders,

For 2016 I would like to wish all of you discipline and patience in your trading!

Greetings!

I have written in the past about the importance of keeping a trading journal.

Many benefits for doing so. From the mental / emotional aspect to the bottom line of keeping notes on market behavior which you can use down the road.

A good example is trading on the last trading day of the month ( example for me is that I dont run one of my systems for bonds on the last trading day of the month). Another example is behavior of markets ( look at stock index futures) on the first trading day of the month.
I think part of the reason for the unique market action ( not always but quite often) during these two days is the activity of large traders, CTA’s who need to report monthly performance, institutions who may need to establish longer term positions on the first of the month etc.

Continue reading “Keeping A Futures Trading Journal 3.02.2016”

ICE Data and Alternatives

Connect with Us! Use Our Futures Trading Levels and Economic Reports RSS Feed.

Like us on FacebookFollow us on TwitterView our profile on LinkedInFind us on Google+Cannon Trading Futures Trading Resistance & Support Levels and Economic ReportsFind us on Yelp

1. Market Commentary
2. Futures Support and Resistance Levels – S&P, Nasdaq, Dow Jones, Russell 2000, Dollar Index
3. Commodities Support and Resistance Levels – Gold, Euro, Crude Oil, T-Bonds
4. Commodities Support and Resistance Levels – Corn, Wheat, Beans, Silver
5. Futures Economic Reports for Tuesday March 1, 2016

Hello Traders,

For 2016 I would like to wish all of you discipline and patience in your trading!

Greetings!

ICE data and alternatives

So as many of you know the ICE exchange has decided to charge all users (professionals and non professional) $110 per month to receive real-time data. This is compared to the CME which charges $86 for professionals (brokers, hedge funds etc.) but a “normal amount of $5 to retail users ( i.e. large percent of the trading public). If you ask me not a bright move on the part of the ICE exchange and they may see volume drop quite a bit on certain markets.

In between, I have more than a few clients who are trading the mini Russell 2000 and like it, but are not so sure about paying $110 per month for the privilege to trade this one….While ICE also hosts coffee, sugar, dollar index and a few other markets, the mini Russell is so far the one that caught most interest.

I did some homework and while the CME does offer the mini Russell 1000, the volume on this one, so far is pathetic….(I think it traded 83 contracts on Friday). HOWEVER….the CME for the same $5 per month most users pay to trade the ES and NQ along with currencies, also has the mid cap 400. Symbol is EMD on the Transactand Shogun platforms as well as E-futures International.

Not bad volume, same tick size as mini Russell 2000 and from the quick research seems to move in similar ways. Worth exploring, perhaps using in demo mode or simply following price movement as the ICE change will go in effect April 1st.

Continue reading “ICE Data and Alternatives”

Trading 201: Day Trading Crude Oil futures

Connect with Us! Use Our Futures Trading Levels and Economic Reports RSS Feed.

Like us on FacebookFollow us on TwitterView our profile on LinkedInFind us on Google+Cannon Trading Futures Trading Resistance & Support Levels and Economic ReportsFind us on Yelp

1. Market Commentary
2. Futures Support and Resistance Levels – S&P, Nasdaq, Dow Jones, Russell 2000, Dollar Index
3. Commodities Support and Resistance Levels – Gold, Euro, Crude Oil, T-Bonds
4. Commodities Support and Resistance Levels – Corn, Wheat, Beans, Silver
5. Futures Economic Reports for Friday February 26, 2016

Hello Traders,

For 2016 I would like to wish all of you discipline and patience in your trading!

Greetings!

Trade management is more important than Market Analysis….

Trading 201: Day Trading Crude Oil futures

Crude Oil is one of MY favorite futures market for day trading. Before I dive in and share with you how the volatility in crude oil fits my risk tolerance for day trading and provide a couple of chart examples, we should review some of the specifications of Crude Oil Futures.

Crude Oil Futures have monthly expiration. So each month we trade a different contract month, so one needs to know when is the first notice day and last trading day for crude oil futures in order to always make sure we are trading the proper month with the most liquidity and avoid any chance of getting into delivery situation.

Next is the contract size. Crude Oil futures are based on 1000 barrels. To be honest from a day trading perspective all I care is that each tick or 1 cent fluctuation is $10 against me or in my favor per contract. That means that a move from 92.94 to 92.74 = $200.

Continue reading “Trading 201: Day Trading Crude Oil futures”

Chart of the Day & Support Levels for Gold Futures

Connect with Us! Use Our Futures Trading Levels and Economic Reports RSS Feed.

Like us on FacebookFollow us on TwitterView our profile on LinkedInFind us on Google+Cannon Trading Futures Trading Resistance & Support Levels and Economic ReportsFind us on Yelp

1. Market Commentary
2. Futures Support and Resistance Levels – S&P, Nasdaq, Dow Jones, Russell 2000, Dollar Index
3. Commodities Support and Resistance Levels – Gold, Euro, Crude Oil, T-Bonds
4. Commodities Support and Resistance Levels – Corn, Wheat, Beans, Silver
5. Futures Economic Reports for Wednesday February 17, 2016

Hello Traders,

For 2016 I would like to wish all of you discipline and patience in your trading!

Greetings!

Free Futures and Commodity Trading Daily Research Trial

This service provides you with a current outlook on different commodities and futures markets such as crude oil futures, gold futures and other futures exchanges. You will be able to view a current chart along with current technical view of that specific futures market.

Subscribe to JS Services Price Map Reports

  • Get qualified support and resistance levels for precise risk management on different commodity markets.
  • Get pivot points that highlight shifts in the futures market momentum.
  • Get technical forecasts to keep you on the right side of a specific commodity market.
  • Get proprietary indicator analysis with JS Services’ easy-to-read color-coded futures research tool.

See the Price Map in Action

Follow this link to see the most recent price map produced by JS Services – CHANGES DAILY
Sign Up Today – start your free trial.

Continue reading “Chart of the Day & Support Levels for Gold Futures”

Breakout Trading, Mean Reversion & Levels for Friday 2.19.2016

Connect with Us! Use Our Futures Trading Levels and Economic Reports RSS Feed.

Like us on FacebookFollow us on TwitterView our profile on LinkedInFind us on Google+Cannon Trading Futures Trading Resistance & Support Levels and Economic ReportsFind us on Yelp

1. Market Commentary
2. Futures Support and Resistance Levels – S&P, Nasdaq, Dow Jones, Russell 2000, Dollar Index
3. Commodities Support and Resistance Levels – Gold, Euro, Crude Oil, T-Bonds
4. Commodities Support and Resistance Levels – Corn, Wheat, Beans, Silver
5. Futures Economic Reports for Wednesday February 17, 2016

Hello Traders,

For 2016 I would like to wish all of you discipline and patience in your trading!

Greetings!

Many different ways to make and lose money trading futures, even more so when day trading.

Today’s action in gold futures ( break out) led me to write about:

Three main approaches for trading, in my opinion.

The first is what I call the “trend is your friend”. A trader looks at few different time frames, looking to see if there is an established trend on longer time frame ( example 60 minutes chart) and then trying to look for pull back on lower time frames and “join the trend”. Only works for certain markets and only works few times of the month as most days markets do not have an intraday trend.

Second method is what we call break out. Traders will look for markets that have been in a lower volatility situation using indicators such as ADX for example. Then they will look at the chart to find what they feel are levels that if broken can fuel a stronger move in the same direction. These levels can be extracted visually looking at the chart or using highs/ lows of X periods. This method works better on some markets than others. I noticed that crude oil and gold futures tend to have better chances of a continued breakout move than the mini SP 500 for example.

The third one many traders use and believe in is “mean aversion”. Stock index futures in my opinion will fall into this category many trading days and today’s session ( July 24th 2014) was a good example. Market tested yesterday’s highs, then tested lows and traded in between. Traders will sometimes use RSI or Williams %R to get a feel for when the market gets away from the mean and will use counter trend methods in this case. Use of stops, when counter trend trading is even more important as you do NOT want to get caught on the few days a month when these markets do incur a break out situation…..

Obviously, all methods have good days, bad days and I guarantee you, none of these methods work all the time on all markets. Knowing the above and trying to understand what method should be the primary method for the market YOU trade and which can be used as secondary can help you while trading.

TRADE SMART / TRADE SYSTEMS — for the current rankings as well as actual performance of trading systems traded at Striker, click here.

Continue reading “Breakout Trading, Mean Reversion & Levels for Friday 2.19.2016”