Introduced in the year 1982, Index futures or stock index futures are extremely popular among trading commodities today. While trading, an index future is settled in cash on the value of a certain stock market index. One of the most traded indices is the S&P500.
These are quoted on the basis of either an underlying or a spot price for an index value. There are a number of technicalities involved, most of which you should understand. However, even if you find it tough to comprehend what Index futures are, you can take assistance from the trade experts at Cannon Trading.
We at Cannon Trading want you to understand the basics and the details about Index Futures like our experts do. There are a number of blogs that we list here in our category archive. We recommend that you read these to know for yourself what Index Futures trading is all about.
Trading Resource of the Week – : When and Where Do I exit My Trade?
Whether you’re a day trader, a position trader, a spread trader, or an option trader, some of the mental challenges and the questions to go with them are constant:
Where, When and how do I enter a trade?
How do I define risk and implement any type of risk control, like placing stop orders, or implementing some sort of option protection?
Where and how do I exit a trade, both in the event of a profitable trade and an unsuccessful one?
Hot market of the week is provided by QT Market Center, A swiss army knife charting package that’s not just for Hedgers, Cooperatives and Farmers alike but also for Spread traders, Swing traders and shorter time frame application for intraday traders with a unique proprietary indicator that can be applied to your specific trading needs.
December Cotton satisfied its first upside PriceCount objective recently and corrected. At this point, if the chart can resume its rally with new sustained highs, the second count would project a possible run to the 95.74 area.
PriceCounts – Not about where we’ve been , but where we might be going next!
The PriceCount study is a tool that can help to project the distance of a move in price. The counts are not intended to be an ‘exact’ science but rather offer a target area for the four objectives which are based off the first leg of a move with each subsequent count having a smaller percentage of being achieved. It is normal for the chart to react by correcting or consolidating at an objective and then either resuming its move or reversing trend. Best utilized in conjunction with other technical tools, PriceCounts offer one more way to analyze charts and help to manage your positions and risk. Learn more at www.qtchartoftheday.com
Trading in futures, options, securities, derivatives or OTC products entails significant risks which must be understood prior to trading and may not be appropriate for all investors. Past performance of actual trades or strategies is not necessarily indicative of future results.
Broker’s Trading System of the Week
Are you interested in seeing how two different intraday trading systems perform in real time, live trading?
Cannon Trading offers you weekly updates on the results of these systems, which trade the MNQ (micro mini Nasdaq) and the ES (mini SP) respectively.
You can compare and contrast their strategies, risks, and returns, and decide which one suits your trading goals better. All you need is a minimum account size of $10,000 for the MNQ system and $25,000 for the ES system.
Questions about the markets? trading? platforms? technology? trading systems? Get answers with a complimentary, confidential consultation with a Cannon Trading Company series 3 broker.
Trading Levels for Next Week
Daily Levels for August 28th, 2023
Would you like to receive daily support & resistance levels?
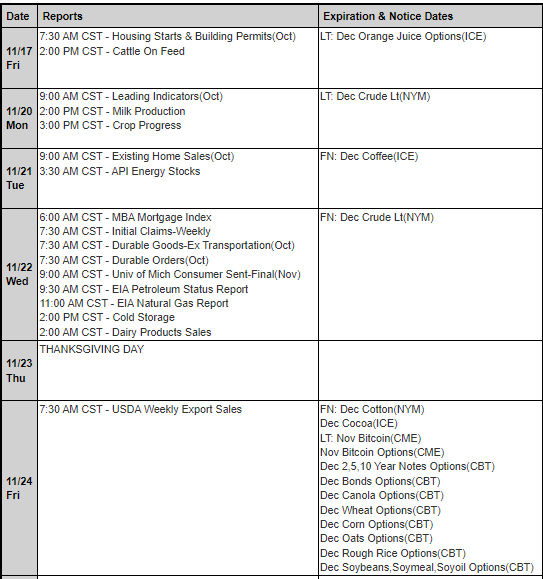
First Notice (FN), Last trading (LT) Days for the Week: www.mrci.com
This is not a solicitation of any order to buy or sell, but a current market view provided by Cannon Trading Inc. Any statement of facts herein contained are derived from sources believed to be reliable but are not guaranteed as to accuracy, nor they purport to be complete. No responsibility is assumed with respect to any such statement or with respect to any expression of opinion herein contained. Readers are urged to exercise their own judgment in trading.
Good Trading!
Trading Futures, Options on Futures, and retail off-exchange foreign currency transactions involves substantial risk of loss and is not suitable for all investors. You should carefully consider whether trading is suitable for you in light of your circumstances, knowledge, and financial resources. You may lose all or more of your initial investment. Opinions, market data, and recommendations are subject to change at any time.
With over 500 companies reporting earnings this week it is near the end of the reporting season. The market will focus Wednesday on the elephant in the room, Nvidia (NVDA Nasdaq).
The boom in Nvidia’s AI-focused business has increased more than 200% year to date, giving it a $1.1 trillion market valuation. Watch for the NQU23 to dance around in a range until AFTER Wednesday’s cash market close.
EPA Estimates are +$2.07 . future guidance will be big for the “internet Index” as AI has been leading the way and Nvidia is the leading GPU maker in the space.
BUT WAIT! that’s not all for the week, it’s time for the Annual “Jackson Hole” conference, a 3 day meeting of top bankers and the FED.
Friday morning @ 10:00am CDT Jerome Powell will set the tone with a speech that could provide a case for the Feds next Fed Rate decision September 20-21st. This is an important meeting next month as it also sets projections by the FED members for GDP, Unemployment rate, Inflation for each year 2023,2024 and 2025.
Watch for increased volatility in the stock indices the last half of the week!
Trading Futures, Options on Futures, and retail off-exchange foreign currency transactions involves substantial risk of loss and is not suitable for all investors. You should carefully consider whether trading is suitable for you in light of your circumstances, knowledge, and financial resources. You may lose all or more of your initial investment. Opinions, market data, and recommendations are subject to change at any time when it comes to Futures Trading.
This is not a solicitation of any order to buy or sell, but a current market view provided by Cannon Trading Inc. Any statement of facts here in contained are derived from sources believed to be reliable, but are not guaranteed as to accuracy, nor they purport to be complete. No responsibility is assumed with respect to any such statement or with respect to any expression of opinion herein contained. Readers are urged to exercise their own judgement in trading.
Hot market of the week is provided by QT Market Center, A swiss army knife charting package that’s not just for Hedgers, Cooperatives and Farmers alike but also for Spread traders, Swing traders and shorter time frame application for intraday traders with a unique proprietary indicator that can be applied to your specific trading needs.
December soybean oil slowed its rally last months against the fall high and corrected. Now, the chart has recovered and is poised for another challenge of the fall and July highs. If we can break out to the upside with new sustained highs, we have a first upside PriceCount projection to the 68.51 area to aim for.
PriceCounts – Not about where we’ve been , but where we might be going next!
The PriceCount study is a tool that can help to project the distance of a move in price. The counts are not intended to be an ‘exact’ science but rather offer a target area for the four objectives which are based off the first leg of a move with each subsequent count having a smaller percentage of being achieved. It is normal for the chart to react by correcting or consolidating at an objective and then either resuming its move or reversing trend. Best utilized in conjunction with other technical tools, PriceCounts offer one more way to analyze charts and help to manage your positions and risk. Learn more at www.qtchartoftheday.com
Trading in futures, options, securities, derivatives or OTC products entails significant risks which must be understood prior to trading and may not be appropriate for all investors. Past performance of actual trades or strategies is not necessarily indicative of future results.
Broker’s Trading System of the Week
Are you interested in seeing how two different intraday trading systems perform in real time, live trading?
Cannon Trading offers you weekly updates on the results of these systems, which trade the MNQ (micro mini Nasdaq) and the ES (mini SP) respectively.
You can compare and contrast their strategies, risks, and returns, and decide which one suits your trading goals better. All you need is a minimum account size of $10,000 for the MNQ system and $25,000 for the ES system.
Questions about the markets? trading? platforms? technology? trading systems? Get answers with a complimentary, confidential consultation with a Cannon Trading Company series 3 broker.
First Notice (FN), Last trading (LT) Days for the Week: www.mrci.com
This is not a solicitation of any order to buy or sell, but a current market view provided by Cannon Trading Inc. Any statement of facts herein contained are derived from sources believed to be reliable but are not guaranteed as to accuracy, nor they purport to be complete. No responsibility is assumed with respect to any such statement or with respect to any expression of opinion herein contained. Readers are urged to exercise their own judgment in trading.
Good Trading!
Trading Futures, Options on Futures, and retail off-exchange foreign currency transactions involves substantial risk of loss and is not suitable for all investors. You should carefully consider whether trading is suitable for you in light of your circumstances, knowledge, and financial resources. You may lose all or more of your initial investment. Opinions, market data, and recommendations are subject to change at any time.
Trading Resource of the Week – Trading Key Economic reports
Hot Market of the Week – September Crude Oil
Broker’s Trading System of the Week – NQ Day Trading System
Trading Levels for Next Week
Trading Reports for Next Week
Trading Resource of the Week – Trading Key Economic Reports
As a trader, you will come across many factors that you must consider before entering or exiting the markets. Some of the most important aspects to look for are economic events that can move the markets drastically one way or another.
There are many types of economic events including releases by a governing body, changes in sales or consumption of commodities, and increases in supply and demand. All of these can affect the markets you trade, making it important for you to know how and when these changes are happening.
Hot market of the week is provided by QT Market Center, A swiss army knife charting package that’s not just for Hedgers, Cooperatives and Farmers alike but also for Spread traders, Swing traders and shorter time frame application for intraday traders with a unique proprietary indicator that can be applied to your specific trading needs.
September Crude Oil completed it’s first upside PriceCount objective and had a brief break. At this point, if the market can maintain the bullish tone, the next upside PriceCount objective comes at 89.31
PriceCounts – Not about where we’ve been , but where we might be going next!
The PriceCount study is a tool that can help to project the distance of a move in price. The counts are not intended to be an ‘exact’ science but rather offer a target area for the four objectives which are based off the first leg of a move with each subsequent count having a smaller percentage of being achieved. It is normal for the chart to react by correcting or consolidating at an objective and then either resuming its move or reversing trend. Best utilized in conjunction with other technical tools, PriceCounts offer one more way to analyze charts and help to manage your positions and risk. Learn more at www.qtchartoftheday.com
Trading in futures, options, securities, derivatives or OTC products entails significant risks which must be understood prior to trading and may not be appropriate for all investors. Past performance of actual trades or strategies is not necessarily indicative of future results.
With algorithmic trading systems becoming more prevalent in portfolio diversification, the following system has been selected as the broker’s choice for this month.
The performance shown above is hypothetical in that the chart represents returns in a model account. The model account rises or falls by the average single contract profit and loss achieved by clients trading actual money pursuant to the listed system’s trading signals on the appropriate dates (client fills), or if no actual client profit or loss available – by the hypothetical single contract profit and loss of trades generated by the system’s trading signals on that day in real time (real‐time) less slippage, or if no real time profit or loss available – by the hypothetical single contract profit and loss of trades generated by running the system logic backwards on back adjusted data. Please read full disclaimer HERE.
Questions about the markets? trading? platforms? technology? trading systems? Get answers with a complimentary, confidential consultation with a Cannon Trading Company series 3 broker.
First Notice (FN), Last trading (LT) Days for the Week: www.mrci.com
This is not a solicitation of any order to buy or sell, but a current market view provided by Cannon Trading Inc. Any statement of facts herein contained are derived from sources believed to be reliable but are not guaranteed as to accuracy, nor they purport to be complete. No responsibility is assumed with respect to any such statement or with respect to any expression of opinion herein contained. Readers are urged to exercise their own judgment in trading.
Good Trading!
Trading Futures, Options on Futures, and retail off-exchange foreign currency transactions involves substantial risk of loss and is not suitable for all investors. You should carefully consider whether trading is suitable for you in light of your circumstances, knowledge, and financial resources. You may lose all or more of your initial investment. Opinions, market data, and recommendations are subject to change at any time.
Rest of the Trading Week, by Mark O’Brien, Senior Broker
General:
The answer is: Germany, Denmark, Netherlands, Sweden, Norway, Switzerland, Luxembourg, Singapore and Australia.
The question is: name the remaining countries whose credit is rated AAA by all three ratings companies – S&P Global, Fitch and Moody’s – after Fitch downgraded the United States’ debt rating from its top-tier AAA, down to AA+.
Among the contributing factors leading to the downgrade, Fitch cited, “the expected fiscal deterioration over the next three years, a high and growing general government debt burden, and the erosion of governance . . . that has manifested in repeated debt limit standoffs and last-minute resolutions.”
Remember in 2011, even though at that time a debt-limit deal was reached, S&P Global lowered the U.S.’s credit rating from AAA down to AA+ and it has not recovered since.
Canada is rated AAA by two of the ratings companies.
Stock Indexes:
Probably not surprisingly, as of this typing, stock indexes reacted negatively to the ratings news with the E-mini Dow Jones losing more than 300 points, roughly a 2% haircut. The E-mini Nasdaq is off ±325 points, a similar 2% correction.
Energy:
As the stock market foundered, crude oil felt weak in the knees as well and by mid-session, the September contract had sold off $3.00 per barrel from its Sunday opening. This despite today’s EIA crude oil stocks report showing a 17 million barrel reduction in U.S. crude stocks; the largest drop in inventories since 1982.
Grains:
After trading within 13 cents of its April 2022 highs last week, November soybeans factored in an expected conga line of wet weather fronts moving broadly over the U.S. Midwest and sold off ±$1.00 down to ±$13.25/bushel, a $5,000 per contract move, the bulk of which comprised just three trading sessions. Estimates for this year’s crop are a virtual wild card given the approach of August, its most critical growing period, so expect volatile price movement throughout.
Trading Futures, Options on Futures, and retail off-exchange foreign currency transactions involves substantial risk of loss and is not suitable for all investors. You should carefully consider whether trading is suitable for you in light of your circumstances, knowledge, and financial resources. You may lose all or more of your initial investment. Opinions, market data, and recommendations are subject to change at any time when it comes to Futures Trading.
This is not a solicitation of any order to buy or sell, but a current market view provided by Cannon Trading Inc. Any statement of facts here in contained are derived from sources believed to be reliable, but are not guaranteed as to accuracy, nor they purport to be complete. No responsibility is assumed with respect to any such statement or with respect to any expression of opinion herein contained. Readers are urged to exercise their own judgement in trading.
“Non Farm Payrolls and may the good Earnings continue.”
For roughly the half way mark in this earnings season, believe it or not, earnings are following expectations and declining for the third straight quarter.
Let me say that again, AS EXPECTED, earnings are declining for the third straight quarter. As expected, according to FACTSET the largest quarterly earnings decline since Q2 2020 is @ -7.3% projected this quarter for all combined reports. But Wait! the indices are high fliers? !! for the year the Nasdaq is up 36%, the S&P is up 20% and the Dow is up nearly 7%.
Why? The economic data continues to surprise to the upside, When Bad is not as bad as expectations”? and after street pundits have been calling for a recession over the past 18 months and the Labor market still characterized as “tight” by Fed Chair Powell last week we have a dichotomy in Fiction vs Fact that is driving prices higher as a “softlanding” with perhaps nary a recession will result from all the fed tightening when the Fed Board declares inflation whipped is gaining traction with some economists.
The tight labor market is keeping the recession from creeping into our economy, BTW earnings expectations have been largely muted and the bar substantially lowered however, earnings so far, even though the lowest since Q@ 2020, have exceeded analysts expectations over 80% of the time this quarter.
This week AMD, CAT PFEW SBUX report after the close on Tuesday. AAPL and AMZN report Thursday after the close.
On the Economic Data front the biggest reports are employment based, JOLTS 9AM CDT Tuesday, ADP 7:15 CDT Wednesday, Jobless Claims at 7:30 am CDT and the big Monthly NonFarm Payrols on Friday @ 7:30 CDT
Trading Futures, Options on Futures, and retail off-exchange foreign currency transactions involves substantial risk of loss and is not suitable for all investors. You should carefully consider whether trading is suitable for you in light of your circumstances, knowledge, and financial resources. You may lose all or more of your initial investment. Opinions, market data, and recommendations are subject to change at any time when it comes to Futures Trading.
This is not a solicitation of any order to buy or sell, but a current market view provided by Cannon Trading Inc. Any statement of facts here in contained are derived from sources believed to be reliable, but are not guaranteed as to accuracy, nor they purport to be complete. No responsibility is assumed with respect to any such statement or with respect to any expression of opinion herein contained. Readers are urged to exercise their own judgement in trading.
Trading Resource of the Week – Parabolics & Bollinger Bands
Hot Market of the Week – November Beans
Broker’s Trading System of the Week – NQ Day Trading System
Trading Levels for Next Week
Trading Reports for Next Week
Important Notices – FX Trading Contest
Participate in the upcoming Currency Cup: FX Trading Challenge where you’ll trade our suite of highly liquid benchmark FX contracts in a risk-free environment while competing against other traders for the chance to win cash prizes.
Learn how to trade FX futures and options
Through participation in our challenge, you’ll receive daily exclusive educational videos where you’ll learn about the key benefits of trading FX futures contracts.
This competition is open to residents in the United States (US), Canada (CA) excluding Quebec, *Brazil (BR), United Kingdom (UK), Germany (DE), Netherlands (NL), Switzerland (CH), United Arab Emirates (UAE), Dubai International Financial Centre (DIFC), Abu Dhabi Global Market (ADGM), Republic of Korea (KR), Taiwan (TW), and Japan (JP).
*Residents of Brazil must have a bank account in the United States to be eligible to receive a prize.
Trading Resource of the Week – Parabolics and Bollinger Band
By Ilan Levy-Mayer, VP
Watch video below on how you can utilize the Bollinger bands and parabolics studies in different ways.
Try a FREE demo of the platform used to show the charts in this educational article. The platform is FREE and has charts, news, DOM, T&S, Alerts, advanced order entry, options and MUCH MORE!
Hot market of the week is provided by QT Market Center, A swiss army knife charting package that’s not just for Hedgers, Cooperatives and Farmers alike but also for Spread traders, Swing traders and shorter time frame application for intraday traders with a unique proprietary indicator that can be applied to your specific trading needs.
November Beans Extended the rally above $14 when the chart is attacking overhead and the December High ($14.27 )and last Springs contract High ($14.48). New sustained highs above these levels would open the top side for a possible run to the low percentage fourth upside PriceCount objective near the 15.82 area
PriceCounts – Not about where we’ve been , but where we might be going next!
The PriceCount study is a tool that can help to project the distance of a move in price. The counts are not intended to be an ‘exact’ science but rather offer a target area for the four objectives which are based off the first leg of a move with each subsequent count having a smaller percentage of being achieved. It is normal for the chart to react by correcting or consolidating at an objective and then either resuming its move or reversing trend. Best utilized in conjunction with other technical tools, PriceCounts offer one more way to analyze charts and help to manage your positions and risk. Learn more at www.qtchartoftheday.com
Trading in futures, options, securities, derivatives or OTC products entails significant risks which must be understood prior to trading and may not be appropriate for all investors. Past performance of actual trades or strategies is not necessarily indicative of future results.
With algorithmic trading systems becoming more prevalent in portfolio diversification, the following system has been selected as the broker’s choice for this month.
The performance shown above is hypothetical in that the chart represents returns in a model account. The model account rises or falls by the average single contract profit and loss achieved by clients trading actual money pursuant to the listed system’s trading signals on the appropriate dates (client fills), or if no actual client profit or loss available – by the hypothetical single contract profit and loss of trades generated by the system’s trading signals on that day in real time (real‐time) less slippage, or if no real time profit or loss available – by the hypothetical single contract profit and loss of trades generated by running the system logic backwards on back adjusted data. Please read full disclaimer HERE.
Questions about the markets? trading? platforms? technology? trading systems? Get answers with a complimentary, confidential consultation with a Cannon Trading Company series 3 broker.
First Notice (FN), Last trading (LT) Days for the Week: www.mrci.com
This is not a solicitation of any order to buy or sell, but a current market view provided by Cannon Trading Inc. Any statement of facts herein contained are derived from sources believed to be reliable but are not guaranteed as to accuracy, nor they purport to be complete. No responsibility is assumed with respect to any such statement or with respect to any expression of opinion herein contained. Readers are urged to exercise their own judgment in trading.
Good Trading!
Trading Futures, Options on Futures, and retail off-exchange foreign currency transactions involves substantial risk of loss and is not suitable for all investors. You should carefully consider whether trading is suitable for you in light of your circumstances, knowledge, and financial resources. You may lose all or more of your initial investment. Opinions, market data, and recommendations are subject to change at any time.
Highlights, Announcements by Mark O’Brien, Senior Broker
General:
Forecasts for the U.S. economy continue to reduce the chances of recession – or if one arrives its lower severity – as readings for reports like the Consumer & Producer Price Indexes and Personal Consumption continue to show inflation is coming under control. At the same time, fear has dissipated that the Federal Reserve’s interest rate policies will destabilize the business climate, particularly as it related to employment and hiring, albeit having cooled somewhat last month. Signs indeed point to the FOMC taking more of a wait-and-see stance in its upcoming meetings than the sense of tenacity it shown in raising rates eleven consecutive times ending in May. In the background, the U.S. dollar has drifted south giving exports a boost.
Agricultural:
Orange Juice futures (basis Sept.) traded to new all-time highs this week on the heels of Tuesday’s USDA crop report showing the U.S. orange crop’s 23% decline from last year and the smallest since 1937. As of this typing prices touched $2.9155 per pound intraday (contract size: 15,000 pounds). This is a substantial 90-cent price increase for the year, including a ±40-cent/$6,000 per contract move up in price this month alone.
The extreme heat across parts of the U.S., including low triple-digit temperatures forecast in key soybean and corn production areas next week have further threatened this year’s already stressed crops. In addition, grain supply disruptions related to the war in Ukraine are adding pressure on global grain supplies. Soybean futures (basis August) remain near their contract highs close to $15.00 per bushel and corn futures (basis September) have climbed back above $5.50 per bushel intraday today and yesterday, half-way back to its mid-June highs near $6.25 per bushel.
Financial:
What a run for stock index futures the last two weeks. Prior to what looks like a meaningful down day today, the Dow Jones cash market had risen seven consecutive days – since Mon. July 10 – its longest winning streak since March 2021. The Sept. YM futures contract made a similar move: up ±1450 points from its closing price of Friday July 7 to Wednesday’s intraday high. That’s a $7,250 per contract move. The ES made a similar ±8,500 per contract move and the NQ made an impressive ±$17,100 move.
Sign up for the Cannon Trading via CME Group FX Futures Trading Challenge for your chance to sizzle the competition this summer – Trade futures currencies like the euro, Canadian dollar, Yen, British pound and other contracts in a risk-free environment while competing with fe11ow traders for a cash prize•.
Trading Futures, Options on Futures, and retail off-exchange foreign currency transactions involves substantial risk of loss and is not suitable for all investors. You should carefully consider whether trading is suitable for you in light of your circumstances, knowledge, and financial resources. You may lose all or more of your initial investment. Opinions, market data, and recommendations are subject to change at any time when it comes to Futures Trading.
This is not a solicitation of any order to buy or sell, but a current market view provided by Cannon Trading Inc. Any statement of facts here in contained are derived from sources believed to be reliable, but are not guaranteed as to accuracy, nor they purport to be complete. No responsibility is assumed with respect to any such statement or with respect to any expression of opinion herein contained. Readers are urged to exercise their own judgement in trading.
Govt Reports, Earnings and the Fed Blackout period.
On the close of Business June 16th the S&P was at 4453.00, today we have a hi as of this writing, with 3.5 more hours to go in the session, of 4553.50 Up 100 points and of course, not in a straight line.
This does illustrate a continued bullish undertone. S&P + .022%, The NQ is up .035% and the broadest market index, the Russell index, the winner over this time period, up .041% .
This brings us to a number of questions: can the rally that begin in March continue through the summer? What factors is the market watching for clues and direction?
This week the most meaningful economic numbers to be released should be the June data on retail and food services sales at 7:30am CT on Tuesday. Inflation expectations are overall well-anchored, if at levels a bit above where they were before the current episode began in 2021.
Earnings season has arrived. Last week the JPM and C released their numbers, This week the Regional Banks will start reporting results in addition to B of A, Morgan Stanley and Goldman Sachs, the Tech and consumer stocks the market will be very interested with are Tesla and Netflix. United Airlines reports as well.
Expectations are certainly muted from a year ago, and the lowered expectations have already been inserted on the game board by most analysts and ratings firms. Therefore, any good news should have a positive impact on the indices continued grind higher.
Of note this week is the Fed Black out period in advance of the July 25-26 meeting where traders are currently expecting another .25 rate hike after the last sessions pause.
Trading Futures, Options on Futures, and retail off-exchange foreign currency transactions involves substantial risk of loss and is not suitable for all investors. You should carefully consider whether trading is suitable for you in light of your circumstances, knowledge, and financial resources. You may lose all or more of your initial investment. Opinions, market data, and recommendations are subject to change at any time when it comes to Futures Trading.
This is not a solicitation of any order to buy or sell, but a current market view provided by Cannon Trading Inc. Any statement of facts here in contained are derived from sources believed to be reliable, but are not guaranteed as to accuracy, nor they purport to be complete. No responsibility is assumed with respect to any such statement or with respect to any expression of opinion herein contained. Readers are urged to exercise their own judgement in trading.
Trading Resource of the Week – Trading Pattern: Rectangle Trading
Hot Market of the Week – August Live Cattle
Broker’s Trading System of the Week – ES Day Trading System
Trading Levels for Next Week
Trading Reports for Next Week
Important Notices – FX Trading Contest
Participate in the upcoming Currency Cup: FX Trading Challenge where you’ll trade our suite of highly liquid benchmark FX contracts in a risk-free environment while competing against other traders for the chance to win cash prizes.
Learn how to trade FX futures and options
Through participation in our challenge, you’ll receive daily exclusive educational videos where you’ll learn about the key benefits of trading FX futures contracts.
This competition is open to residents in the United States (US), Canada (CA) excluding Quebec, *Brazil (BR), United Kingdom (UK), Germany (DE), Netherlands (NL), Switzerland (CH), United Arab Emirates (UAE), Dubai International Financial Centre (DIFC), Abu Dhabi Global Market (ADGM), Republic of Korea (KR), Taiwan (TW), and Japan (JP).
*Residents of Brazil must have a bank account in the United States to be eligible to receive a prize.
Trading Resource of the Week – : Rectangle Trading Pattern
By Joe Easton, Senior Broker
Formation:
This pattern is defined as price coming into a tight range between support and resistance
This pattern is a continuation pattern. If the trend was up it will continue up and down it will continue down
Typically, volume is lower through this period of consolidation.
Try a FREE demo of the platform used to show the charts in this educational article. The platform is FREE and has charts, news, DOM, T&S, Alerts, advanced order entry, options and MUCH MORE!
In the examples above the range is creating a rectangle pattern in an uptrend. Ideally this pattern breaks higher without breaking lower support. If lower support is broken this pattern would no longer be a rectangle.
How to Trade:
The ideal entry is toward the bottom of the rectangle support. If entered on this line your stop should be below support. Price should bounce off support 2 to 3 times to be confident support is present.
The more conservative entry would be when the resistance in the rectangle is broken. This can happen very quickly and needs to be timed more accurately. The lower support line then becomes your stop. You could also make the resistance line become your stop.
When price breaks out you can measure the width of rectangle and project the price to move from the breakout that same distance at a minimum.
Summary:
Rectangles patterns exist in low volume consolidation in both uptrends and downtrends. Price corrects in two ways, time and price. This would classify more as a time correction considering price stays relatively consistent. Once price closes above the resistance you can expect the price to not retrace back into the rectangle. If there is a false breakout, the continuation is less likely to occur. Generally, if you are able to spot a rectangle you can expect the price trend to continue.
Important: Trading commodity futures and options involves a substantial risk of loss.
The recommendations contained in this chart are of opinion only and do not guarantee any profits.
Past performances are not necessarily indicative of future results
Hot market of the week is provided by QT Market Center, A swiss army knife charting package that’s not just for Hedgers, Cooperatives and Farmers alike but also for Spread traders, Swing traders and shorter time frame application for intraday traders with a unique proprietary indicator that can be applied to your specific trading needs.
August Live cattle Is extending its rally into new highs where the chart is taking aim at its low percentage fourth upside PriceCount to the 183.30 area. This objective is consistent with the weekly chart High established last month it should be enough to satisfy this phase of the bull market.
PriceCounts – Not about where we’ve been , but where we might be going next!
The PriceCount study is a tool that can help to project the distance of a move in price. The counts are not intended to be an ‘exact’ science but rather offer a target area for the four objectives which are based off the first leg of a move with each subsequent count having a smaller percentage of being achieved. It is normal for the chart to react by correcting or consolidating at an objective and then either resuming its move or reversing trend. Best utilized in conjunction with other technical tools, PriceCounts offer one more way to analyze charts and help to manage your positions and risk. Learn more at www.qtchartoftheday.com
Trading in futures, options, securities, derivatives or OTC products entails significant risks which must be understood prior to trading and may not be appropriate for all investors. Past performance of actual trades or strategies is not necessarily indicative of future results.
With algorithmic trading systems becoming more prevalent in portfolio diversification, the following system has been selected as the broker’s choice for this month.
The performance shown above is hypothetical in that the chart represents returns in a model account. The model account rises or falls by the average single contract profit and loss achieved by clients trading actual money pursuant to the listed system’s trading signals on the appropriate dates (client fills), or if no actual client profit or loss available – by the hypothetical single contract profit and loss of trades generated by the system’s trading signals on that day in real time (real‐time) less slippage, or if no real time profit or loss available – by the hypothetical single contract profit and loss of trades generated by running the system logic backwards on back adjusted data. Please read full disclaimer HERE.
Questions about the markets? trading? platforms? technology? trading systems? Get answers with a complimentary, confidential consultation with a Cannon Trading Company series 3 broker.
First Notice (FN), Last trading (LT) Days for the Week: www.mrci.com
This is not a solicitation of any order to buy or sell, but a current market view provided by Cannon Trading Inc. Any statement of facts herein contained are derived from sources believed to be reliable but are not guaranteed as to accuracy, nor they purport to be complete. No responsibility is assumed with respect to any such statement or with respect to any expression of opinion herein contained. Readers are urged to exercise their own judgment in trading.
Good Trading!
Trading Futures, Options on Futures, and retail off-exchange foreign currency transactions involves substantial risk of loss and is not suitable for all investors. You should carefully consider whether trading is suitable for you in light of your circumstances, knowledge, and financial resources. You may lose all or more of your initial investment. Opinions, market data, and recommendations are subject to change at any time.
RISK DISCLOSURE: Past results are not necessarily indicative of future results. The risk of loss in futures trading can be substantial, carefully consider the inherent risks of such an investment in light of your financial condition.