SP 500 Futures Testing Major Support Zone – Levels & Reports for 8.8.2014

Hello Traders,

For 2014 I would like to wish all of you discipline and patience in your trading!

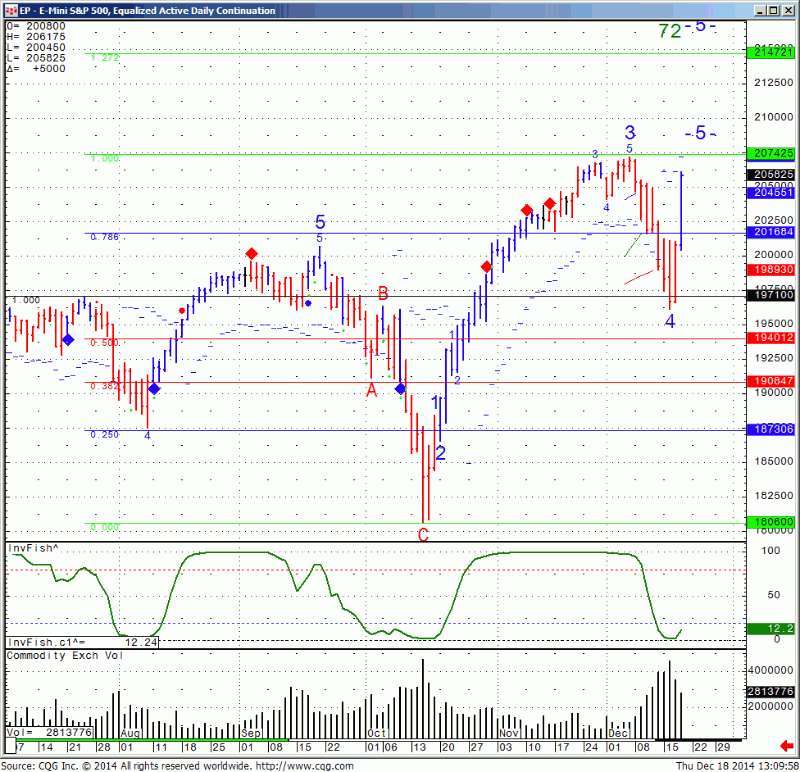
SP 500 made new lows and about to test a series of support levels as one can see in the daily chart below:

We have few levels of support between 1885 and 1896.50 in case we break again below the psychological 1900 mark.

I mentioned a couple of days ago support of 1795 by mistake and was asked by few of the readers. That was a typo the support I meant to write is 1895.

Looks like we will visit that level and zone very soon, maybe as early as night session. My best guess is for an initial bounce of that level. Just a guess. Either way I will look to see what kind of reaction we get if and when we get down there.

A strong bounce may signal some more upside, however a break below 1895-1885 level may actually make my 1795 typo into a reality… 822

Continue reading “SP 500 Futures Testing Major Support Zone – Levels & Reports for 8.8.2014”

Day Trading Money Management + Levels & Reports for 8.7.2014

Hello Traders,

For 2014 I would like to wish all of you discipline and patience in your trading!

A word or two about day-trading and money management…..


Trading futures and even more so, day-trading futures has grown significantly over the last few years, as seen by the increase in daily volume on some of the more popular electronic markets. (The Mini SP had 3,575,702 contracts traded on February 27th! Yes, that is 3.575 MILLION contracts….)

New traders as well as more experienced traders often wonder and search for the “holy grail” and the answer is different for each trader. Many factors influence what may be a good route for one trader versus a better alternative for another. Experience, risk tolerance, the person’s schedule, financial situation along with other factors will greatly influence what is a suitable trading method for one trader or another.

One COMMON solution different traders can implement when it comes to day-trading is what I call: “Treat your daily Profit/Loss as you would treat an open trade” and allow me to expand:

As brokers we have seen different traders survive in this business, making progress and even getting to the point of consistently finding their set ups, however their main downfall is that “one bad day” where they may give up recent gains, lose a large percentage of their account or even lose their whole account.

A practical solution for eliminating those disastrous days and giving you a better chance for survival is using “stop losses, trailing stop losses and daily stop limits” for every given trading day.

Let’s assume for hypothetical purposes that trader A is day-trading with $10,000 of risk capital. Part of her preparation for trading should be an understanding of her trading style, how active she is, how much on average does she risk per trade and other factors to help her calculate what her DAILY LOSS LIMIT should be. If you as a trader can be discipline enough to set your own daily loss limit and on days when you have reached your daily loss limit, simply stop trading for that day, you will give yourself better odds in surviving the day-trading arena and preventing days where you may loss a big portion of your account. Surviving to trade another day is a crucial element when it comes to day-trading.

Continue reading “Day Trading Money Management + Levels & Reports for 8.7.2014”

Futures Levels and Economic Reports 7.24.2014

Connect with Us! Use Our Futures Trading Levels and Economic Reports RSS Feed.

Like us on FacebookFollow us on TwitterView our profile on LinkedInFind us on Google+Cannon Trading Futures Trading Resistance & Support Levels and Economic ReportsFind us on Yelp

1. Market Commentary
2. Futures Support and Resistance Levels – S&P, Nasdaq, Dow Jones, Russell 2000, Dollar Index
3. Commodities Support and Resistance Levels – Gold, Euro, Crude Oil, T-Bonds
4. Commodities Support and Resistance Levels – Corn, Wheat, Beans, Silver
5. Futures Economic Reports for Thursday July 24, 2014

Hello Traders,

For 2014 I would like to wish all of you discipline and patience in your trading!

Getting Clues from other markets?

When day trading a specific market do you only look at the chart for that specific market? Maybe you took it a step further and you are viewing multiple time frame charts for the same market which is a good step in my eyes.

Now lets take this even one step further by observing what markets have correlation, direct or inverse to the market you are trading, perhaps this can help you make decisions when trading.

I will give a few examples from my experience:

When I am in a position in the mini SP 500, I will often observe what the bonds are doing ( many times inverse correlation), I will take notice of what the Dow, Russell and NASDAQ are doing as well ( direct correlation).

If I am trading crude oil, I will many times pay attention to what unleaded gas and heating oil are doing (very close, although not direct correlation) as well as what WTI crude is doing.

One more example may be when I have a position trade in beans and I will try to get a feel for the overall direction of the grain markets (is there a trend? are they sideways?) by looking at corn, wheat in general and then look to see what bean oil and soy meal which are by products of beans are doing.

One question that can be asked is “what do you mean observe this or that market”? and a good example will be:

Lets say I am short the mini SP 500 and I am not sure if to take profit or not. I look at the mini Russell and see that mini Russell just made new lows, that will give me more confidence to stay in my short position as I feel there might be more room to the downside.

Continue reading “Futures Levels and Economic Reports 7.24.2014”

Long Term Traders to Follow Futures Indices Prices on Last Trading Day of May

Jump to a section in this post:

1. Market Commentary
2. Support and Resistance Levels – S&P, Nasdaq, Dow Jones, Russell 2000, Dollar Index
3. Support and Resistance Levels – Gold, Euro, Crude Oil, T-Bonds
4. Support and Resistance Levels – Corn, Wheat, Beans, Silver
5. Economic Reports for Thursday May 31, 2012

Hello Traders,

Heads up traders! front month for bonds, ten years and other financials is now September.

Front month for gold is August.

June is still front month for indices and currencies.

Mini Russell daily chart for your review below. An attempt to rally off the lows fizzled today and tomorrow can provide some clues for future direction. Tomorrow being the last day in May will provide some longer term traders with a fresh look at the weekly and monthly charts, so the close tomorrow may be significant.

Close below 760 may suggest new lows to follow, close above 780 may signal continued bounce higher.

Trade with patience, trade with discipline and good trading to all.


Daily chart of the mini Russell 2000 Index for your review below for your review:

mini Russell 2000 Index daily Continue reading “Long Term Traders to Follow Futures Indices Prices on Last Trading Day of May”

Equities Indices Futures Rollover Dates – ES, NQ, TF, EMD, YM – September 2011

The equities futures contracts affected are listed below:

Contracts Rollover Date New Month & Symbol
ES Thursday 9/8/11 December, ‘Z’
TF Thursday 9/8/11 December, ‘Z’
NQ Thursday 9/8/11 December, ‘Z’
EMD Thursday 9/8/11 December, ‘Z’
YM Thursday 9/8/11 December, ‘Z’

We recommend that all new positions be placed in the December contract as of Thursday’s trade date.

Please close any open September Currencies positions by the close on Friday, September 16th.

Should you have any further questions please contact your futures broker.

Futures Trading Levels, Stock Indeces Bounce Back

Strong bounce on stock indices today across the board. As one can see, market is volatile and one day it seems the market just can’t stop selling, the next it flips around and runs higher….part of volatility, part of uncertainty, fear and greed.

the only advice I can share at this point is be ready for the unexpected. Know yourself, what your goals are out of each trade, how much risk tolerance you have the stomach for and then and only then decide on a trading strategy.

Levels to be aware of as volatility will resume in the mini S&P 500 below:

Daily Futures chart of the S&P 500 from August 23rd, 2011

Daily Futures chart of the S&P 500 from August 23rd, 2011

Trading Futures, Options on Futures, and retail off-exchange foreign currency transactions involves substantial risk of loss and is not suitable for all investors. You should carefully consider whether trading is suitable for you in light of your circumstances, knowledge, and financial resources. You may lose all or more of your initial investment. Opinions, market data, and recommendations are subject to change at any time. Continue reading “Futures Trading Levels, Stock Indeces Bounce Back”

Futures Trading Levels, We Now Trade September Indeces and Currencies

Cannon Trading / E-Futures.com

June To September Rollover Notice

Please note that we are now trading September indices as well as September currencies.

Make sure you DO NOT HOLD ANY JUNE CURRENCIES in your account.

Should you have any further questions please contact your futures broker.

Daily chart of the DOW JONES CASH INDEX for your review below.

We have been trading lower on good volume and for now the trend points lower. Wishing you a great weekend and good trading week to come. Continue reading “Futures Trading Levels, We Now Trade September Indeces and Currencies”

Futures Trading Levels, Mini Russell 2000 Leads Indices; Newsletter

Cannon Trading / E-Futures.com

Weekly newsletter along with free access to SP500 squawk box at:

Cannon Trading Inc. Weekly Newsletter.

Daily chart of mini Russell 2000 ( which I currently see as the leader of Indices as far as price action) below with potential upside and downside levels: Continue reading “Futures Trading Levels, Mini Russell 2000 Leads Indices; Newsletter”

Futures Trading Levels, Now Trading June Indices, E-Minis and Currencies

Cannon Trading / E-Futures.com

We are NOW TRADING JUNE FOR INDICES< EMINIS and CURRENCIES!!!

Daily chart of ES below. Todays sell off stopped almost exactly on the 50% retracment level from lows from Nov. 16th 2010 to the highs we made Feb 21st this year

Daily E-Mini S&P 500 futures trading chart screenshot from today March 15th 2011

Stock futures trading chart levels Tuesday March 15th 2011 Continue reading “Futures Trading Levels, Now Trading June Indices, E-Minis and Currencies”