Mini S&P Chart & Economic Reports 12.19.2014
Posted By:- Ilan Levy-Mayer Vice President, Cannon Trading Futures Blog
Connect with Us! Use Our Futures Trading Levels and Economic Reports RSS Feed.
![]()
![]()
![]()
![]()
![]()
![]()
1. Market Commentary
2. Futures Support and Resistance Levels – S&P, Nasdaq, Dow Jones, Russell 2000, Dollar Index
3. Commodities Support and Resistance Levels – Gold, Euro, Crude Oil, T-Bonds
4. Commodities Support and Resistance Levels – Corn, Wheat, Beans, Silver
5. Futures Economic Reports for Friday December 19, 2014
Hello Traders,
For 2014 I would like to wish all of you discipline and patience in your trading!
Recent moves in the stock market don’t stop to amaze me…. FED changes language in statement slightly and we jump over 2.5%!!!
Hard to predict what will happen next, at least for me it is. We have seen days where the market closes down sharply only to make a U turn the next day and vice versa.
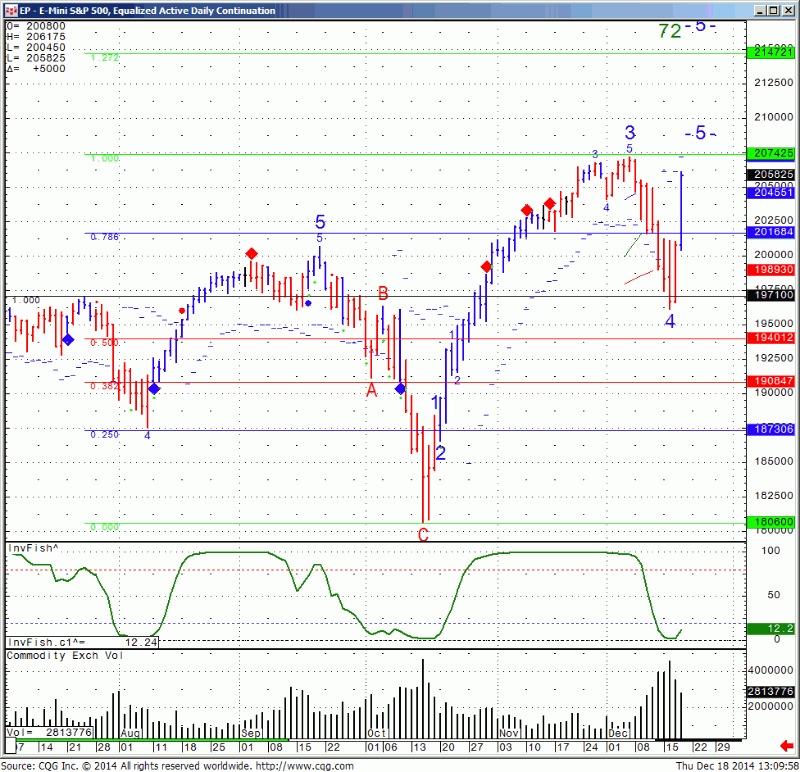
Below is a daily chart of the mini SP, if we break the recent highs of 2072, then next targets are 2094 and 2170.
Our blog is nominated for the STAR award once again!
Please vote for our blog at:
Once there, scroll to the blog category and select
Daily Futures Trading Levels and Insight as your first place and submit at bottom of the page!
GOOD TRADING
Trading Futures, Options on Futures, and retail off-exchange foreign currency transactions involves substantial risk of loss and is not suitable for all investors. You should carefully consider whether trading is suitable for you in light of your circumstances, knowledge, and financial resources. You may lose all or more of your initial investment. Opinions, market data, and recommendations are subject to change at any time.
If you like Our Futures Trading Daily Support and Resistance Levels, Please share!
| Contract March 2014 | SP500 | Nasdaq100 | Dow Jones | Mini Russell | Dollar Index |
| Resistance 3 | 2136.25 | 4425.75 | 18366 | 1215.47 | 90.18 |
| Resistance 2 | 2099.00 | 4347.75 | 18055 | 1202.43 | 89.90 |
| Resistance 1 | 2079.00 | 4306.25 | 17890 | 1195.37 | 89.69 |
| Pivot | 2041.75 | 4228.25 | 17579 | 1182.33 | 89.40 |
| Support 1 | 2021.75 | 4186.75 | 17414 | 1175.27 | 89.19 |
| Support 2 | 1984.50 | 4108.75 | 17103 | 1162.23 | 88.91 |
| Support 3 | 1964.50 | 4067.25 | 16938 | 1155.17 | 88.70 |
| Contract | Feb. Gold | Mar.Silver | Feb. Crude Oil | Mar. Bonds | March Euro |
| Resistance 3 | 1237.4 | 16.67 | 62.69 | 146 29/32 | 1.2434 |
| Resistance 2 | 1225.6 | 16.45 | 60.87 | 146 5/32 | 1.2398 |
| Resistance 1 | 1212.0 | 16.18 | 57.93 | 144 28/32 | 1.2347 |
| Pivot | 1200.2 | 15.96 | 56.11 | 144 4/32 | 1.2311 |
| Support 1 | 1186.6 | 15.69 | 53.17 | 142 27/32 | 1.2260 |
| Support 2 | 1174.8 | 15.47 | 51.35 | 142 3/32 | 1.2224 |
| Support 3 | 1161.2 | 15.20 | 48.41 | 140 26/32 | 1.2173 |
| Contract | March Corn | March Wheat | Jan. Beans | Jan. SoyMeal | Jan. bean Oil |
| Resistance 3 | 418.5 | 659.7 | 1049.33 | 378.87 | 32.26 |
| Resistance 2 | 416.0 | 658.1 | 1043.67 | 373.43 | 32.13 |
| Resistance 1 | 413.5 | 656.7 | 1039.33 | 369.37 | 32.01 |
| Pivot | 411.0 | 655.1 | 1033.67 | 363.93 | 31.88 |
| Support 1 | 408.5 | 653.7 | 1029.3 | 359.9 | 31.8 |
| Support 2 | 406.0 | 652.1 | 1023.67 | 354.43 | 31.63 |
| Support 3 | 403.5 | 650.7 | 1019.33 | 350.37 | 31.51 |
source:http://www.forexfactory.com/calendar.php
All times are Eastern time Zone (EST)
This is not a solicitation of any order to buy or sell, but a current market view provided by Cannon Trading Inc. Any statement of facts here in contained are derived from sources believed to be reliable, but are not guaranteed as to accuracy, nor they purport to be complete. No responsibility is assumed with respect to any such statement or with respect to any expression of opinion herein contained. Readers are urged to exercise their own judgment in trading.


