Tips for day trading NYMEX crude oil futures
By Ilan Levy-Mayer, VP Cannon Trading Co, Inc.
When it comes to day trading futures contracts, crude oil futures are assumed one of the leading positions as far as trading volume.
During the month of May 2018, crude oil futures averaged around 1 Million contracts traded per day! That actually surpasses contracts like the ten-year notes, mini SP, mini Nasdaq and others who have traditionally been leaders’ in terms of volume.
Part of the growth in crude oil futures is attributed to day trader participation. Day traders, by definition, will enter and exit their positions during the same trading day. This adds volume to the market traded.
Some of the tips I am sharing below can be applied to most futures contracts as well as other financial products that are traded like stocks, forex, bonds and others. Some of the advice I am sharing is very specific to the crude oil futures trading field.
- Know the product you are trading:
- Just like a trader who trades a stock like Facebook knows what Facebook does, when its earning reports are due and other factors, so does a crude oil futures day trader needs to know a few facts about crude oil:
- Contract Size: Crude Oil Futures consist of 1,000 barrels. For the trader this means that each full $1 move in crude futures = $1,000 against you or in your favor.
For example: A move from 72.10 to 73.10 = $1,000 and a move from 72.10 to 72.11 = $10 (the minimum fluctuation size or the tick size). Be aware that the CME also offers the mini crude contract, which is half the size.
- Trading Hours: Crude oil futures trade on the Globex terminal between the hours of 5:00 PM CST the DAY BEFORE to 4:00 PM CST the following day. Which means 23 hours of straight trading. It is important to know that most of the volume will trade between the hours of 8:00 AM CST and 1:30 PM CST, as these hours correspond to the “pit session” of the old trading floor.
Another key aspect to remember is that crude oil is a deliverable commodity and the “front month” will change every 30 days or so. For example: since May 22nd 2018 we have been trading July crude oil.
- Reports: There are more than a few reports that will affect crude oil future prices indirectly. These include monthly unemployment, the FOMC rate decision, and a few others.
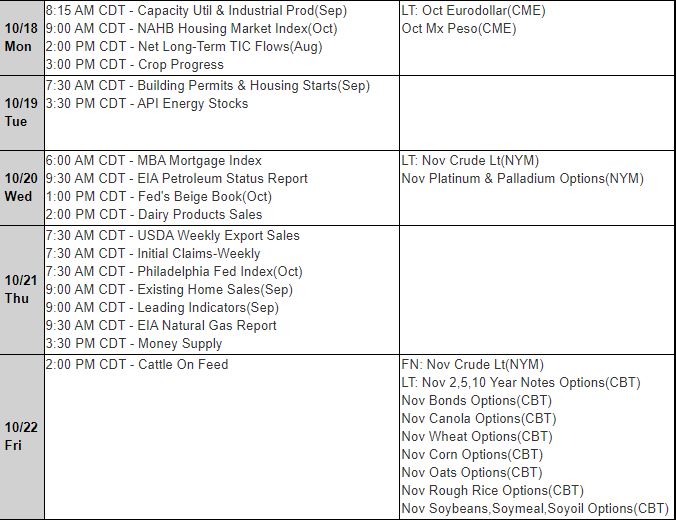
However, there are two major reports that move crude oil futures and its by-products (unleaded gasoline and heating oil) sharply: The API report, which comes out at 3:30 PM CST every Tuesday, and the DOE (Dept. of Energy) inventory numbers, which come out almost every Wednesday at 9:30AM CST.
Take a look at this one-minute chart from Wednesday, May 16th right around the report time below to understand the volatility involved.
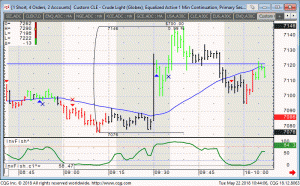
As you can see above, the market made a move of $700 per ONE contract in a matter of minutes, perhaps even seconds! That type of risk and opportunity is one of the factors attracting day-traders into the crude oil market.
- Geo Political Events: Middle East tensions, the Iran nuclear deal, tensions between Iraq and its neighbors…these are all examples of events that affect crude oil prices. Not to mention OPEC meetings!
- Trading Personality:
In my opinion crude oil (like many other markets) will have one of the following 3 modes: trending, two-sided volatility, or Choppy/quiet/range bound trading.
My experience is that crude will more often fall into the first 2 categories: strong trend or two-sided volatility. This leads me to my next point below, different trading set-ups.
- Trading Set-Ups:
My preferred methods for trading crude are either breakout concept in an attempt to catch a strong move up or down once the market broke some key support or resistance levels, AND/OR counter trend methods to take advantage of when the market is oversold or overbought. Crude does seem to bring more fear and greed out of traders. So looking at RSI levels, for example, and using moving averages ON the RSI to try and get a feel for market reversals are methods worth exploring.
- Keep a journal:
Like with any other trading, keep a journal. Take notes on how the market reacted to certain reports, how the markets traded during certain times of the day, and action you took and emotions you had that either helped or hurt you while trading. These notes will help you going forward.
In summary, crude oil futures volume has increased significantly these past few years. The crude oil futures offer traders certain dynamics that other markets may not at certain times. Volatility, fear and greed are key traits for this market. Remember that trading crude oil futures specifically and futures and options in general carries a large degree of risk and is not suitable for all investors. Make sure you consult with a series 3 broker if you never traded this market before. As always, I wish you Good Trading!
Important: Trading commodity futures and options involves a substantial risk of loss.
The recommendations contained in this letter are of opinion only and do not guarantee any profits.
There is not an actual account trading these recommendations.
Past performances are not necessarily indicative of future results.


