Jump to a section in this post:
1. Market Commentary
2. Support and Resistance Levels – S&P, Nasdaq, Dow Jones, Russell 2000
3. Support and Resistance Levels – Gold, Euro, Crude Oil, T-Bonds
4. Support and Resistance Levels – March Corn, March Wheat, Jan Beans, March Silver
5.Economic Report for February 29, 2012
Hello Traders,
Many clients have asked me: “What time frame you like to use for your charts?”
And my answer is: it really varies….
It depends if I am in scalping/ short day trading mode, if I am looking for bigger/ larger intraday moves or perhaps Swing trading and it depends on the market I am looking at.
When it comes to the Crude oil market for example I like to look first at the 15 minutes chart, followed by 1300 VOLUME chart.
I like volume charts for intraday, short term type of trades because I think when it comes for quick in and out, volume plays more important part than time. Sometimes market may be slow and with out much action and time charts will simply provide false indicators because certain amount of time has passed and a new bar will draw on the chart. On the other hand there are times when volume pours in, market is fast and moving and if you wait for your 3 or 5 minute chart bar to complete…you may miss the move. That is when volume charts have an edge in my opinion.
If the market is fast and volume is coming in, volume charts will draw faster and provide you with signals faster than time charts.
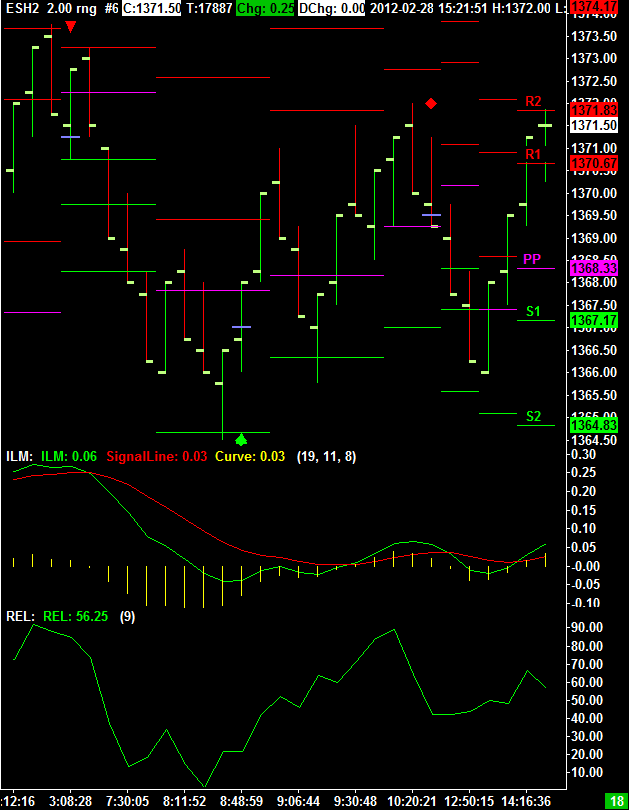
When it comes to the mini SP I also like to take a look at range bar charts along with variable pivot points, like the one you can see below. Especially the last few months with the tight range in the SP500, range bars can give traders another perspective.

Would you like to have access to my DIAMOND and TOPAZ ALGOs as shown above and be able to apply for any market and any time frame on your own PC ? You can now have a two weeks free trial where I enable the ALGO along with few studies for your own sierra/ ATcharts.
If so, please send me an email with the following information:
1. Are you currently trading futures?
2. Charting software you use?
3. If you use sierra or ATcharts, please let me know the user name so I can enable you
4. Markets you currently trading?
2. Support and Resistance Levels – S&P, Nasdaq, Dow Jones, Russell 2000
| Contract (Dec. 2011) | SP500 (big & Mini) |
Nasdaq100 (big & Mini) |
Dow Jones (big & Mini) |
Mini Russell |
| Resistance Level 3 | 1380.93 | 2669.67 | 13087 | 842.33 |
| Resistance Level 2 | 1376.42 | 2652.33 | 13047 | 836.67 |
| Resistance Level 1 | 1373.83 | 2642.67 | 13025 | 829.63 |
| Pivot Point | 1369.32 | 2625.33 | 12985 | 823.97 |
| Support Level 1 | 1366.73 | 2615.67 | 12963 | 816.93 |
| Support Level 2 | 1362.22 | 2598.33 | 12923 | 811.27 |
| Support Level 3 | 1359.63 | 2588.67 | 12901 | 804.23 |
3. Support & Resistance Levels for Gold, Euro, Crude Oil, and U.S. T-Bonds
| Contract | April. Gold | March Euro | Feb. Crude Oil | March. Bonds |
| Resistance Level 3 | 1822.8 | 1.3575 | 110.72 | 145 5/32 |
| Resistance Level 2 | 1807.7 | 1.3524 | 109.75 | 144 26/32 |
| Resistance Level 1 | 1797.1 | 1.3492 | 108.23 | 144 7/32 |
| Pivot Point | 1782.0 | 1.3441 | 107.26 | 143 28/32 |
| Support Level 1 | 1771.4 | 1.3409 | 105.74 | 143 9/32 |
| Support Level 2 | 1756.3 | 1.3358 | 104.77 | 142 30/32 |
| Support Level 3 | 1745.7 | 1.3326 | 103.25 | 142 11/32 |
4. Support & Resistance Levels for Corn, Wheat, Beans and Silver
| Contract | March Corn | March Wheat | March Beans | March. Silver |
| Resistance Level 3 | 670.4 | 681.8 | 1327.00 | 3961.8 |
| Resistance Level 2 | 664.1 | 675.4 | 1320.50 | 3845.7 |
| Resistance Level 1 | 660.7 | 671.8 | 1316.50 | 3771.3 |
| Pivot Point | 654.3 | 665.4 | 1310.00 | 3655.2 |
| Support Level 1 | 650.9 | 661.8 | 1306.0 | 3580.8 |
| Support Level 2 | 644.6 | 655.4 | 1299.50 | 3464.7 |
| Support Level 3 | 641.2 | 651.8 | 1295.50 | 3390.3 |
5. Economic Reports
2:45am EUR
French Consumer Spending m/m
3:55am EUR
German Unemployment Change
5:00am EUR
CPI y/y
5:00am EUR
Core CPI y/y
8:30am USD
Prelim GDP q/q
8:30am USD
Prelim GDP Price Index q/q
9:45am USD
Chicago PMI
10:00am USD
Fed Chairman Bernanke Testifies
10:30am USD
Crude Oil Inventories
2:00pm USD
Beige Book
