________________________________________________
Voted #1 Blog and #1 Brokerage Services on TraderPlanet for 2016!!
_________________________________________________
Dear Traders,
Trading 201: Enhance Your Trading With a Series of Short Videos
Watch the latest trading videos we’ve created and shared with our clients!
In this week’s newsletter we are sharing some videos on trading, each a few minutes long. The videos discuss practical tips for trading and sharing our experience with you. Whether you’re an experienced trader or a newcomer, we believe you can enhance and add something new to your trading after watching these videos. Enjoy!
1. Using Bollinger Bands as a possible tool for exiting trades
2. One way you can use the Parabolics study ( also known as PSAR) to manage your trades, possibly by integrating a trailing stop
3. Different ways traders can utilize support and resistance levels in their trading.
4. Entering trades on a stop, using “price confirmation”.
5. Utilizing Range Bar charts for shorter term trading as a way to try and filter out some noise.
6. How to identify support and resistance levels
7. Using fear and greed to day trade crude oil futures.
Stay safe out there both physically and in the markets…
Good Trading
Trading Futures, Options on Futures, Dow Futures, and retail off-exchange foreign currency transactions involves substantial risk of loss and is not suitable for all investors. You should carefully consider whether trading is suitable for you in light of your circumstances, knowledge, and financial resources. You may lose all or more of your initial investment. Opinions, market data, and recommendations are subject to change at any time when it comes to Futures Trading.
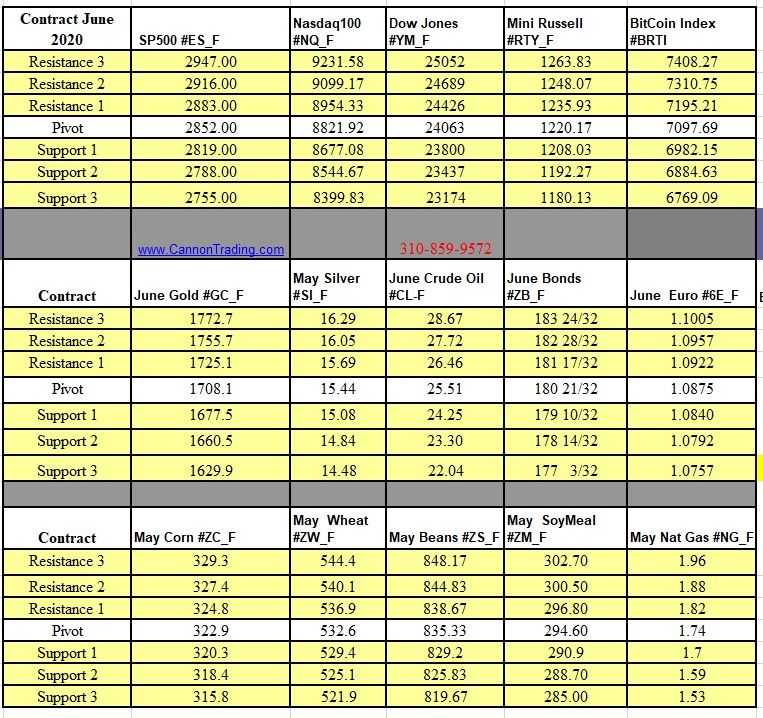
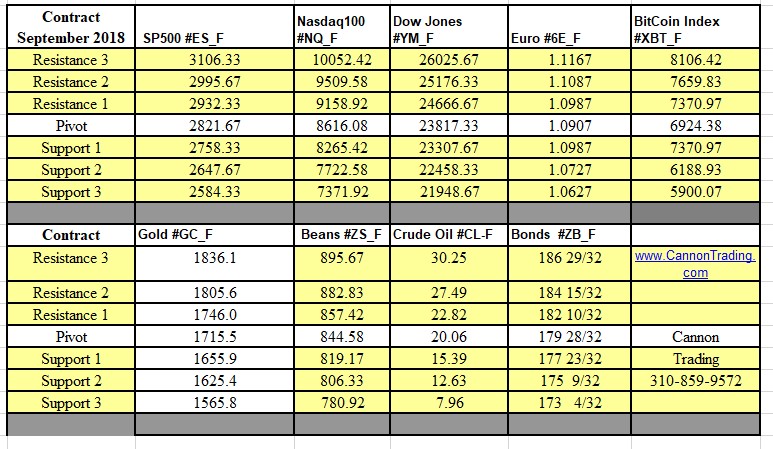
Futures Trading Levels
04-20-2020
WEEKLY Levels for April 20th-24th
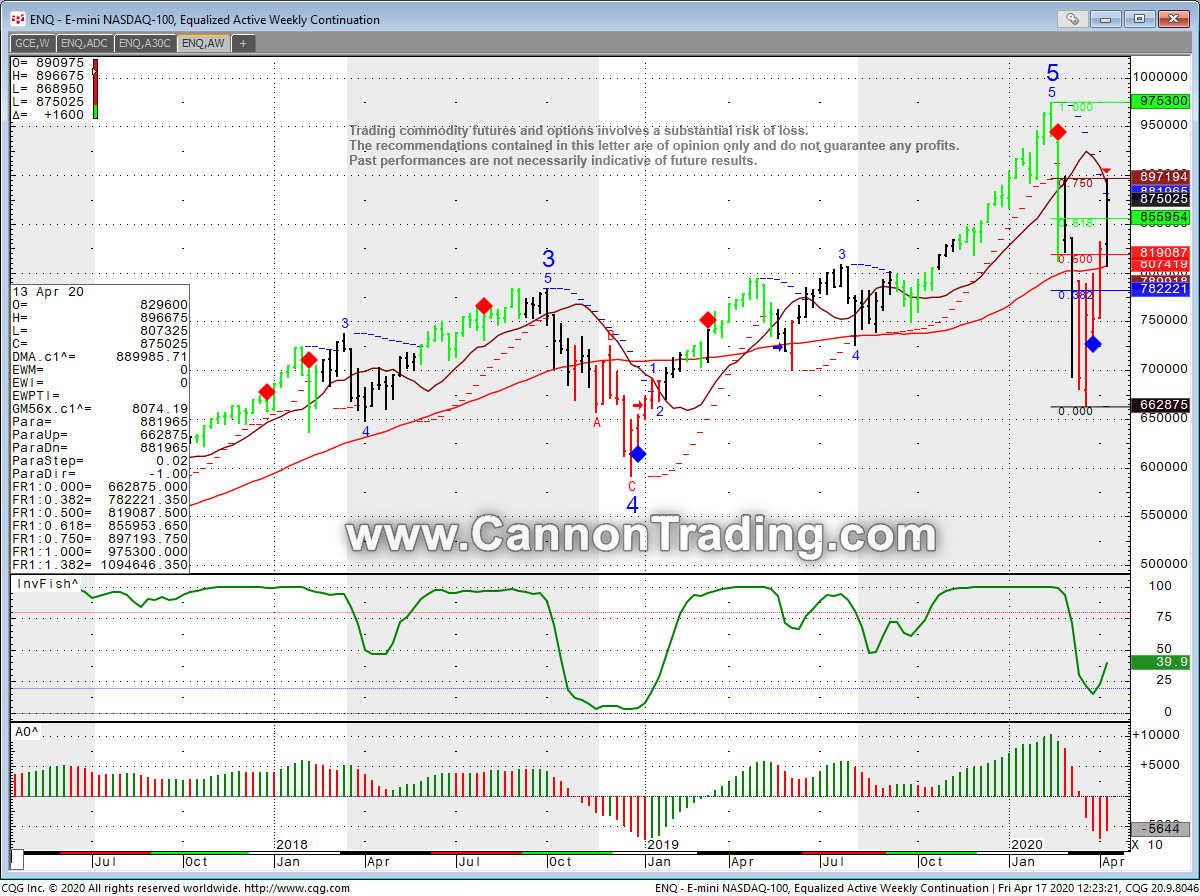
Weekly NQ (mini NASDAQ 100) chart below for your review as we tested the 75% retracement levels on the volatile spike Thursday night!!!
Did you know?
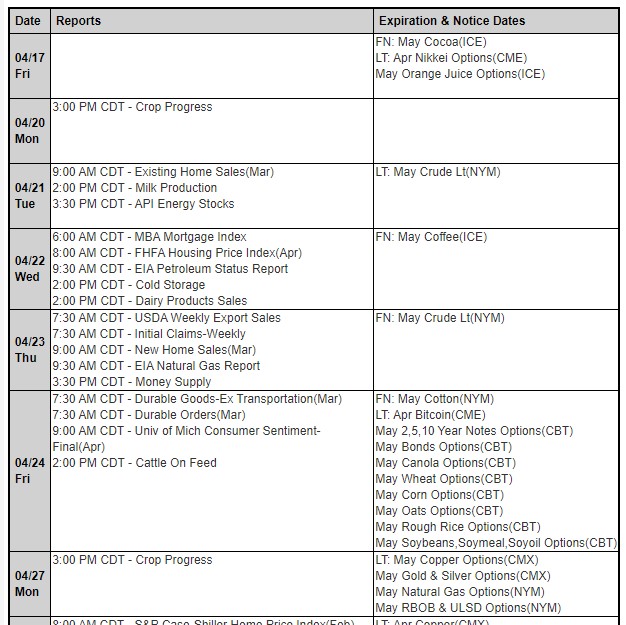
Economic Reports, source:

Order to buy or sell, but a current market view provided by Cannon Trading Inc. Any statement of facts here in contained are derived from sources believed to be reliable, but are not guaranteed as to accuracy, nor they purport to be complete. No responsibility is assumed with respect to any such statement or with respect to any expression of opinion herein contained. Readers are urged to exercise their own judgement in trading and Dow Futures.


