Crude Oil Chart | Support and Resistance Levels

Jump to a section in this post:
1. Market Commentary
2. Support and Resistance Levels – S&P, Nasdaq, Dow Jones, Russell 2000
3. Support and Resistance Levels – Gold, Euro, Crude Oil, T-Bonds
4. Support and Resistance Levels – March Corn, March Wheat, Jan Beans, March Silver
5.Economic Report for March 6, 2012
Hello Traders,

Another day of light economic reports ahead of us before we go into a stretch of 3 FULL days of important economic reports with the biggest ones on Friday, monthly unemployment and USDA for the grains.

I think that some days, the biggest challenge a day-trader may have is NOT taking trades when there are no set ups.

I know from experience and talking to clients, that here are days when there very few set ups if at all, but the day-trader feels he or she didn’t do their job because they did not take any trades….at that point, they will look for trades when normally he/she would not take that type of trades. That usually leads to negative results. While it may be frustrating not to have set ups you like, the disciplined trader will continue to wait patiently, as hard as it may be, knowing that “no trade, is better than a bad trade”. This is how I felt about today’s trading in stock indices for most of the day….

Crude Oil on the other hand, had a few good set ups and this is part of the reason I like to follow about 2-4 different markets for day trading. I try to pick markets from different segments, so I will look at either the mini SP or the mini Russell. I like the crude oil market and gold and at times I will take a look at one of the grain markets OR the Euro or any other market that has low correlation with the other ones I look at.

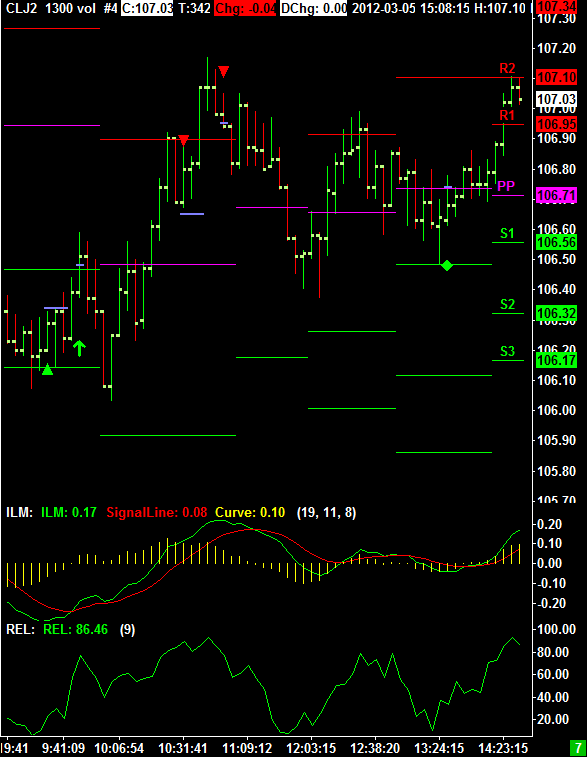
Below is a volume chart from today’s crude oil market using volume charts:

Market Commentary Continue reading “Crude Oil Chart | Support and Resistance Levels”

Tuesday Morning Support and Resistance

Here’s a morning cup o’ joe for all you futures traders, our morning support and resistance levels. Good trading!

divider black 190

Support and Resistance Levels – S&P 500, Nasdaq 100, Dow Jones, Mini Russell 2000, 30-Year US Bond, 10-Year US Note

Contract Mini S&P 500 (Mar) Mini Nasdaq 100 (Mar) Dow Jones (Mar) Mini Russell 2000 (Mar) 30-Year US Bond (June) 10-Year US Note (June)
Resistance Level 3——————————————Resistance Level 2 

——————————————

Resistance Level 1

——————————————

Support Level 1

——————————————

Support Level 2

——————————————

Support Level 3

1377.251367.5


1361.5


1350.5


1348


1332.5

26502628


2613


2583


2569


2563

1304212969


12925


12912


12973


12833

814.8809.9


804.3


793.8


784.60


769.2

1422514208


14123


14102


14021


13924

13128.513115


13109


13029


13022


13010

Continue reading “Tuesday Morning Support and Resistance”

Monday Morning Support and Resistance

Here’s a morning cup o’ joe for all you futures traders, our morning support and resistance levels. Good trading!

divider black 190

Support and Resistance Levels – S&P 500, Nasdaq 100, Dow Jones, Mini Russell 2000, 30-Year US Bond, 10-Year US Note

Contract Mini S&P 500 (Mar) Mini Nasdaq 100 (Mar) Dow Jones (Mar) Mini Russell 2000 (Mar) 30-Year US Bond (June) 10-Year US Note (June)
Resistance Level 3—————————————— Resistance Level 2——————————————

Resistance Level 1

——————————————

Support Level 1

——————————————

Support Level 2

——————————————

Support Level 3

1381.751377.25


1371


1366.5


1360.75


1355.5

26632650.25


2641


2623


2608


2596

1313313042


12985


12912


12973


12833

815.7811


805.6


792.20


784.60


769.2

1420814123


14105


14102


14021


13924

13128.513115


13109


13029


13022


13010

Continue reading “Monday Morning Support and Resistance”

Friday Morning Support and Resistance

Here’s a morning cup o’ joe for all you futures traders, our morning support and resistance levels. Good trading!

divider black 190

Support and Resistance Levels – S&P 500, Nasdaq 100, Dow Jones, Mini Russell 2000, 30-Year US Bond, 10-Year US Note

Contract Mini S&P 500 (Mar) Mini Nasdaq 100 (Mar) Dow Jones (Mar) Mini Russell 2000 (Mar) 30-Year US Bond (June) 10-Year US Note (June)
Resistance Level 3 —————————————— Resistance Level 2 ——————————————Resistance Level 1

——————————————

Support Level 1

——————————————

Support Level 2

——————————————

Support Level 3

1385.251381.75

1377


1366.5


1360.75


1355.5

26632653.25

2649


2623


2608


2596

1313313078

13042


12956


12913


12871

824.20820.70

817.1


806.5


801.4


783.20

1420814123

14105


14002


13924


13914

1310913103.5

13029.5


13020


13016.5


13010

Continue reading “Friday Morning Support and Resistance”

Strategy Runner Announcement | Support and Resistance Levels

Jump to a section in this post:
1. Market Commentary
2. Support and Resistance Levels – S&P, Nasdaq, Dow Jones, Russell 2000
3. Support and Resistance Levels – Gold, Euro, Crude Oil, T-Bonds
4. Support and Resistance Levels – March Corn, March Wheat, Jan Beans, March Silver
5.Economic Report for March 2, 2012
Hello Traders,

Cannon Trading is one of the few futures brokers still able to offer Strategy Runner to our clients, if you’re interested in trying a demo contact us today!

You can sign up for a free 30-day demo on our website: https://www.cannontrading.com/platform-strategy-runner.php

2. Support and Resistance Levels – S&P, Nasdaq, Dow Jones, Russell 2000

Contract (March 2012) SP500
(big & Mini)
Nasdaq100
(big & Mini)
Dow Jones
(big & Mini)
Mini Russell
Resistance Level 3 1384.40 2672.67 13086 841.70
Resistance Level 2 1379.70 2659.33 13052 832.70
Resistance Level 1 1376.10 2651.67 13008 823.50
Pivot Point 1371.40 2638.33 12974 814.50
Support Level 1 1367.80 2630.67 12930 805.30
Support Level 2 1363.10 2617.33 12896 796.30
Support Level 3 1359.50 2609.67 12852 787.10

Continue reading “Strategy Runner Announcement | Support and Resistance Levels”

Thursday Morning Support and Resistance

Here’s a morning cup o’ joe for all you futures traders, our morning support and resistance levels. Good trading!

divider black 190

Support and Resistance Levels – S&P 500, Nasdaq 100, Dow Jones, Mini Russell 2000, 30-Year US Bond, 10-Year US Note

Contract Mini S&P 500 (Mar) Mini Nasdaq 100 (Mar) Dow Jones (Mar) Mini Russell 2000 (Mar) 30-Year US Bond (June) 10-Year US Note (June)
Resistance Level 3—————————————— Resistance Level 2——————————————Resistance Level 1

——————————————

Support Level 1

——————————————

Support Level 2

——————————————

Support Level 3

1385.251381.75 

1376


1366.5


1360.75


1355.5

26632653.25 

2645


2619


2607


2619

1313313078 

13042


12956


12913


12871

824.20820.70 

817.1


806.5


801.4


783.20

1421314129 

14112


13924


13914


13505

13104.513030.5 

13024


13012


13001.5


12926

Continue reading “Thursday Morning Support and Resistance”

Wednesday Morning Support and Resistance

Here’s a morning cup o’ joe for all you futures traders, our morning support and resistance levels. Good trading!

divider black 190

Support and Resistance Levels – S&P 500, Nasdaq 100, Dow Jones, Mini Russell 2000, 30-Year US Bond, 10-Year US Note

Contract Mini S&P 500 (Mar) Mini Nasdaq 100 (Mar) Dow Jones (Mar) Mini Russell 2000 (Mar) 30-Year US Bond (June) 10-Year US Note (June)
Resistance Level 3 —————————————— Resistance Level 2 ——————————————

Resistance Level 1

——————————————

Support Level 1

——————————————

Support Level 2

——————————————

Support Level 3

1385.251381.75


1376


1366


1360.5


1355.25

26632647.25


2642


2617


2604


2592

1313313078


13036


12953


12909


12870

841.70835.8


832


823.8


821.6


812.1

1431414301


14226


14206


14123


14110

13203.513126


13119.5


13107.5


13101


13027.5

Continue reading “Wednesday Morning Support and Resistance”

Crude Oil Charts | Support and Resistance Levels

Jump to a section in this post:
1. Market Commentary
2. Support and Resistance Levels – S&P, Nasdaq, Dow Jones, Russell 2000
3. Support and Resistance Levels – Gold, Euro, Crude Oil, T-Bonds
4. Support and Resistance Levels – March Corn, March Wheat, Jan Beans, March Silver
5.Economic Report for February 29, 2012
Hello Traders,

Many clients have asked me: “What time frame you like to use for your charts?”

And my answer is: it really varies….

It depends if I am in scalping/ short day trading mode, if I am looking for bigger/ larger intraday moves or perhaps Swing trading and it depends on the market I am looking at.

When it comes to the Crude oil market for example I like to look first at the 15 minutes chart, followed by 1300 VOLUME chart.

I like volume charts for intraday, short term type of trades because I think when it comes for quick in and out, volume plays more important part than time. Sometimes market may be slow and with out much action and time charts will simply provide false indicators because certain amount of time has passed and a new bar will draw on the chart. On the other hand there are times when volume pours in, market is fast and moving and if you wait for your 3 or 5 minute chart bar to complete…you may miss the move. That is when volume charts have an edge in my opinion.

If the market is fast and volume is coming in, volume charts will draw faster and provide you with signals faster than time charts.

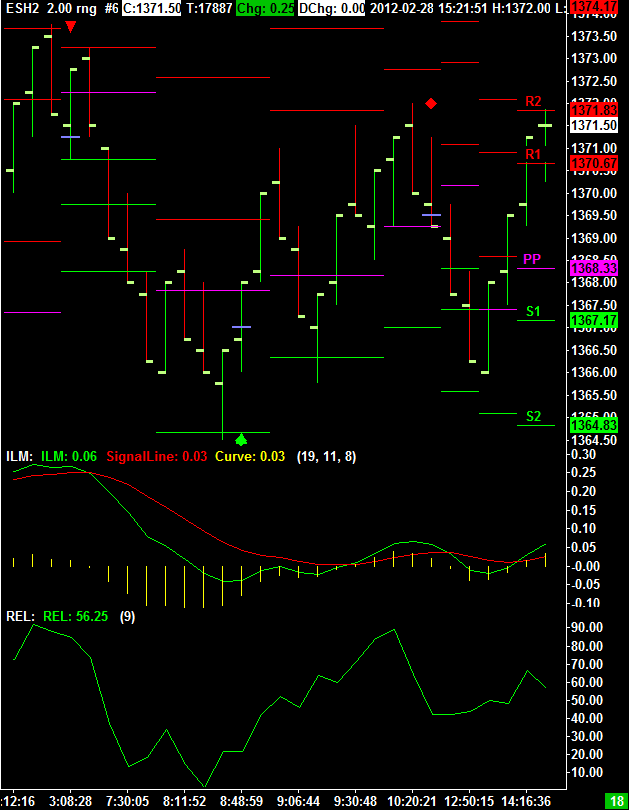
When it comes to the mini SP I also like to take a look at range bar charts along with variable pivot points, like the one you can see below. Especially the last few months with the tight range in the SP500, range bars can give traders another perspective.
Market Commentary

Would you like to have access to my DIAMOND and TOPAZ ALGOs as shown above and be able to apply for any market and any time frame on your own PC ? You can now have a two weeks free trial where I enable the ALGO along with few studies for your own sierra/ ATcharts.

If so, please send me an email with the following information:

1. Are you currently trading futures?
2. Charting software you use?
3. If you use sierra or ATcharts, please let me know the user name so I can enable you
4. Markets you currently trading?

2. Support and Resistance Levels – S&P, Nasdaq, Dow Jones, Russell 2000

Contract (Dec. 2011) SP500
(big & Mini)
Nasdaq100
(big & Mini)
Dow Jones
(big & Mini)
Mini Russell
Resistance Level 3 1380.93 2669.67 13087 842.33
Resistance Level 2 1376.42 2652.33 13047 836.67
Resistance Level 1 1373.83 2642.67 13025 829.63
Pivot Point 1369.32 2625.33 12985 823.97
Support Level 1 1366.73 2615.67 12963 816.93
Support Level 2 1362.22 2598.33 12923 811.27
Support Level 3 1359.63 2588.67 12901 804.23

3. Support & Resistance Levels for Gold, Euro, Crude Oil, and U.S. T-Bonds

Contract April. Gold March Euro Feb. Crude Oil March. Bonds
Resistance Level 3 1822.8 1.3575 110.72 145 5/32
Resistance Level 2 1807.7 1.3524 109.75 144 26/32
Resistance Level 1 1797.1 1.3492 108.23 144 7/32
Pivot Point 1782.0 1.3441 107.26 143 28/32
Support Level 1 1771.4 1.3409 105.74 143 9/32
Support Level 2 1756.3 1.3358 104.77 142 30/32
Support Level 3 1745.7 1.3326 103.25 142 11/32

4. Support & Resistance Levels for Corn, Wheat, Beans and Silver

Contract March Corn March Wheat March Beans March. Silver
Resistance Level 3 670.4 681.8 1327.00 3961.8
Resistance Level 2 664.1 675.4 1320.50 3845.7
Resistance Level 1 660.7 671.8 1316.50 3771.3
Pivot Point 654.3 665.4 1310.00 3655.2
Support Level 1 650.9 661.8 1306.0 3580.8
Support Level 2 644.6 655.4 1299.50 3464.7
Support Level 3 641.2 651.8 1295.50 3390.3

divider black 190

5. Economic Reports

2:45am EUR
French Consumer Spending m/m

3:55am EUR
German Unemployment Change

5:00am EUR
CPI y/y

5:00am EUR
Core CPI y/y

8:30am USD
Prelim GDP q/q

8:30am USD
Prelim GDP Price Index q/q

9:45am USD
Chicago PMI

10:00am USD
Fed Chairman Bernanke Testifies

10:30am USD
Crude Oil Inventories

2:00pm USD
Beige Book
Tuesday Morning Support and Resistance

Here’s a morning cup o’ joe for all you futures traders, our morning support and resistance levels. Good trading!

divider black 190

Support and Resistance Levels – S&P 500, Nasdaq 100, Dow Jones, Mini Russell 2000, 30-Year US Bond, 10-Year US Note

Contract (Mar. 2012) Mini S&P 500 Mini Nasdaq 100 Dow Jones Mini Russell 2000 30-Year US Bond 10-Year US Note
Resistance Level 3—————————————— Resistance Level 2——————————————

Resistance Level 1

——————————————

Support Level 1

——————————————

Support Level 2

——————————————

Support Level 3

1385.251381.75 

1373.5


1363.5


1358


1353

2647.252633 

2622.5


2600


2590


2581

1313313078 

13024


12943


12901


12863

841.70835.8 

832


826.3


823.8


821.6

1440014314 

14226


14200


14119


14107

13203.513126 

13118


13105


13031


13026

Continue reading “Tuesday Morning Support and Resistance”

Monday Morning Support and Resistance Numbers

Here’s a morning cup o’ joe for all you futures traders, our morning support and resistance levels. Good trading!

divider black 190

Support and Resistance Levels – S&P 500, Nasdaq 100, Dow Jones, Mini Russell 2000, 30-Year US Bond, 10-Year US Note

Contract (Mar. 2012) Mini S&P 500 Mini Nasdaq 100 Dow Jones Mini Russell 2000 30-Year US Bond 10-Year US Note
Resistance Level 3—————————————— Resistance Level 2——————————————

Resistance Level 1

——————————————

Support Level 1

——————————————

Support Level 2

——————————————

Support Level 3

1373.51369.5


1363.5


1353


1350.5


1347.5

2622.52609.5


2602


2584


2576


2568

1302413969


12941


12895


12859


12826

835.80832


825.6


817.5


812.4


806.5

1443014408


14327


14304


14224


14213

13203.513126


13124.5


13111.5


13106


13101

Continue reading “Monday Morning Support and Resistance Numbers”