Friday Morning Support and Resistance Numbers

If you would like these numbers before the market opens, make sure you SIGN UP with your email above.

Here’s a morning cup o’ joe for all you futures traders, our morning support and resistance levels. Good trading!

divider black 190

Support and Resistance Levels – S&P 500, Nasdaq 100, Dow Jones, Mini Russell 2000, 30-Year US Bond, 10-Year US Note

Contract (June) Mini S&P 500 Mini Nasdaq 100 Dow Jones Mini Russell 2000 30-Year US Bond 10-Year US Note
Resistance Level 3 ——————————————Resistance Level 2

——————————————

Resistance Level 1

——————————————

Support Level 1

——————————————

Support Level 2

——————————————

Support Level 3

1414.251408.75


1401.5


1390.75


1384.25


1378.5

27922763


2742


2708


2693


2680

1318913070


13017


13093


13038


12990

823.7815.30


814.70


810.4


805.3


800.80

1432614316


14304


14211


14201


14103

13217 (all time high)13210.5

13205.5


13200


13127.5


13122.5

Continue reading “Friday Morning Support and Resistance Numbers”
Crude Oil Futures Market Opportunities | Support and Resistance Levels

Jump to a section in this post:
1. Market Commentary
2. Support and Resistance Levels – S&P, Nasdaq, Dow Jones, Russell 2000
3. Support and Resistance Levels – Gold, Euro, Crude Oil, T-Bonds
4. Support and Resistance Levels – Corn, Wheat, Beans, Silver
5. Economic Reports for Friday April 27, 2012


Hello Traders,

I spend a lot of time talking about stock index futures like mini SP, mini Russell etc.

However there more than a few other markets that have enough volume and volatility to attract daytraders. One of them is Crude oil.

I personally like Crude Oil futures because the “punishment or fulfillment” are pretty fast…and by that i mean that Crude Oil prices are volatile enough most of the times, that day-traders get stopped out with losses or exit with profits much quicker than other markets….Now if you are one of these daytraders who does not believe in stops…Crude Oil futures is not for you.

Each point on Crude Oil futures is $10, so a full $1 move or 100 cents is $1000 against you or in your favor.

We also have the mini Crude which is half the size.


If you have not traded crude before I recommend following it in demo mode, simulating some trades in demo mode before attempting to trade it live. As I said before, this is a volatile market which can work against you pretty fast if you are not disciplined.

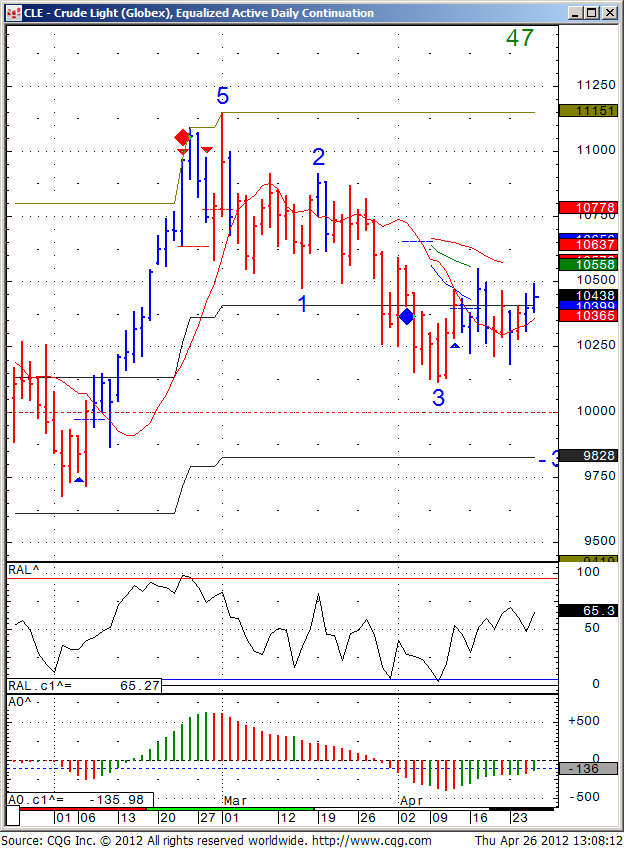
Below you will see my daily chart of crude oil futures where I think we may head lower unless we break above 105.50 ( That is $105.50 per barrel)

Friday is statistically better for SHORTS….

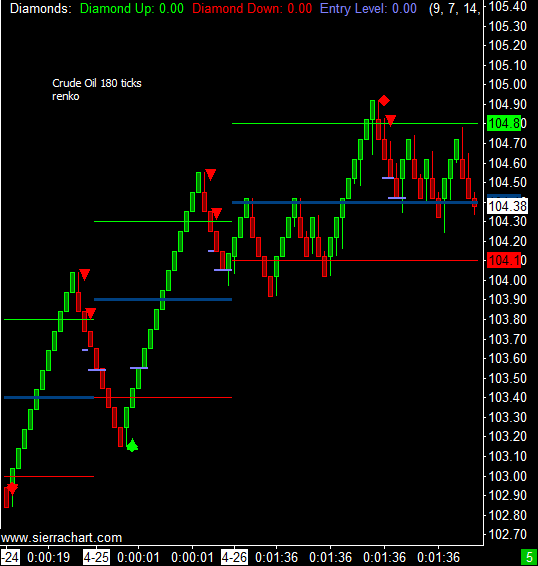
Below the daily chart of crude oil you will see an INTRA DAY chart from todays sessions, where you can get a feel for the market behavior.

Daily chart of June Crude Oil Futures:,

562


Intra day chart of Crude oil futures from today, April 26th 2012

1335471444446

Continue reading “Crude Oil Futures Market Opportunities | Support and Resistance Levels”

Thursday Morning Support and Resistance Numbers

If you would like these numbers before the market opens, make sure you SIGN UP with your email above.

Here’s a morning cup o’ joe for all you futures traders, our morning support and resistance levels. Good trading!

divider black 190

Support and Resistance Levels – S&P 500, Nasdaq 100, Dow Jones, Mini Russell 2000, 30-Year US Bond, 10-Year US Note

Contract (June) Mini S&P 500 Mini Nasdaq 100 Dow Jones Mini Russell 2000 30-Year US Bond 10-Year US Note
Resistance Level 3 ——————————————Resistance Level 2

——————————————

Resistance Level 1

——————————————

Support Level 1

——————————————

Support Level 2

——————————————

Support Level 3

1397.751394


1387.5


1377.75


1373


1368.75

27282708


2688.5


2691


2680


2659

1318913070


13017


12975


12918


12866

823.7815.30


814.70


806.50


802.10


798.20

1432614316


14304


14213


14206


13124

1321713210.5


13204.5


13128.5


13124.5


13117.5

Continue reading “Thursday Morning Support and Resistance Numbers”
FOMC Report and Market Rally | Support and Resistance Levels

Jump to a section in this post:
1. Market Commentary
2. Support and Resistance Levels – S&P, Nasdaq, Dow Jones, Russell 2000
3. Support and Resistance Levels – Gold, Euro, Crude Oil, T-Bonds
4. Support and Resistance Levels – Corn, Wheat, Beans, Silver
5. Economic Reports for Thursday April 26, 2012


Hello Traders,

FOMC came and market continues to rally based on AAPL  (Apple) earnings yesterday…

I shared a good hourly chart of the mini NASDAQ yesterday right before the close with a buy signal that turned out to be a good one….Here is an updated mini NASDAQ 100 hourly chart, with potential targets as well as possible pull backs along with two sell signals that were NOT confirmed by price action
(break below or above dashes):,

kL1V0LBl74cAAAAASUVORK5CYII=


Continue reading “FOMC Report and Market Rally | Support and Resistance Levels”

FOMC Meeting Tomorrow April 25 2012 | Support and Resistance Levels

Jump to a section in this post:
1. Market Commentary
2. Support and Resistance Levels – S&P, Nasdaq, Dow Jones, Russell 2000
3. Support and Resistance Levels – Gold, Euro, Crude Oil, T-Bonds
4. Support and Resistance Levels – Corn, Wheat, Beans, Silver
5. Economic Reports for Wednesday April 25, 2012


Hello Traders,

Be ready for the un expected.

FOMC meeting tomorrow. Statement will be released around 12:30 PM EST 

FOMC days have different characteristics than other trading days. If you have traded for a while, check your trading notes from past FOMC days that may help you prepare for tomorrow.

if you are a newcomer, take a more conservative approach and make sure you understand that the news can really move the market.

My observations suggest choppy, low volume up until announcement, followed by some some sharp volatile moves right during and after the announcement. However, with tomorrow early morning reports and recent volatility, we may see wild action through out.

One advice everyone can benefit from is, reduce your trading size in proportion  to the increase in volatility. This should help your comfort level while in the day-trade.
 Hourly chart of mini NASDAQ 100 for your review below:

Continue reading “FOMC Meeting Tomorrow April 25 2012 | Support and Resistance Levels”

Tuesday Morning Support and Resistance Numbers

If you would like these numbers before the market opens, make sure you SIGN UP with your email above.

Here’s a morning cup o’ joe for all you futures traders, our morning support and resistance levels. Good trading!

divider black 190

Support and Resistance Levels – S&P 500, Nasdaq 100, Dow Jones, Mini Russell 2000, 30-Year US Bond, 10-Year US Note

Contract (June) Mini S&P 500 Mini Nasdaq 100 Dow Jones Mini Russell 2000 30-Year US Bond 10-Year US Note
Resistance Level 3 ——————————————Resistance Level 2

——————————————

Resistance Level 1

——————————————

Support Level 1

——————————————

Support Level 2

——————————————

Support Level 3

1376.251372


1367.75


1359.25


1354


1351.5

27012680


2668


2641


2625


2575

1307012961


12928


12837


12809


12748

802.10798.20


794.3


781.7


780


772.2

1441414326


14316


14114


14017


13924

13218.513211


13205.5


13109.5


13027


13014.5

Continue reading “Tuesday Morning Support and Resistance Numbers”

Monday Morning Support and Resistance Numbers

If you would like these numbers before the market opens, make sure you SIGN UP with your email above.

Here’s a morning cup o’ joe for all you futures traders, our morning support and resistance levels. Good trading!

divider black 190

Support and Resistance Levels – S&P 500, Nasdaq 100, Dow Jones, Mini Russell 2000, 30-Year US Bond, 10-Year US Note

Contract (June) Mini S&P 500 Mini Nasdaq 100 Dow Jones Mini Russell 2000 30-Year US Bond 10-Year US Note
Resistance Level 3 —————————————— Resistance Level 2 ——————————————

Resistance Level 1

——————————————

Support Level 1

——————————————

Support Level 2

——————————————

Support Level 3

1378.51374.75


1371.25


1359.25


1351.5


1335.75

27012680


2668


2699


2681


2672

1297612926


12898


12837


12809


12748

804.7801.6


798.50


787.6


780


772.2

1441414326


14316


14110


14014


13922

13218.513211


13205.5


13109


13027


13014.5

Continue reading “Monday Morning Support and Resistance Numbers”

New Chart Format | Support and Resistance Levels


Jump to a section in this post:
1. Market Commentary
2. Support and Resistance Levels – S&P, Nasdaq, Dow Jones, Russell 2000
3. Support and Resistance Levels – Gold, Euro, Crude Oil, T-Bonds
4. Support and Resistance Levels – Corn, Wheat, Beans, Silver
5. Economic Reports for Friday April 19, 2012


Hello Traders,

I have incorporated new chart format into the daily live charts service I hold. Below is a screen shot from what I consider a great day ( mini Russell chart from the second half of todays session).  Before I get too excited I must see how the bad days look like because I know every method/ system/ concept have good and bad days.

I will keep you posted and in between if you like to see what my live charts screen sharing is all about, you can register for a free trial here.

Continue reading “New Chart Format | Support and Resistance Levels”