Futures Trading Tips, Levels & Reports 8.15.2014

Hello Traders,

For 2014 I would like to wish all of you discipline and patience in your trading!


Just like a basketball player doesn’t just show up for the game a minute before and starts playing, so does a trader need to prepare him/herself for trading.


You may not need to warm or shoot around but it definitely does not hurt to visualize successful trading, be rested, relaxed and more specifically, know the following:


↔What reports are coming out

↔Overview of longer time frames

↔Key support and resistance levels

↔Go over your equity run

↔Make sure your surroundings will enable you to trade

↔Fit trading into your schedule, life style not viceversa

↔E-mail us to be added to a daily newsletter which outlines reports and levels for each trading day


Continue reading “Futures Trading Tips, Levels & Reports 8.15.2014”

Gold Daily Continuation Chart – Levels & Reports 8.14.2014

Hello Traders,

For 2014 I would like to wish all of you discipline and patience in your trading!


So I was doing some research and signal evaluator work on some candlesticks formation to go along with some of the conditions I like to use and figured might as well share some of the basic knowledge with my readers…

The following is taken from my CQG trading/chart terminal. If anyone is interested in a free trial, feel free to email me or visit our CQG section on our website.

So today, two formations I started exploring:

1. Engulfing Bearish

The Engulfing Bearish formation is, of course, a bearish formation and therefore its symbol (EG) will always appear at the top of the formation. It represents the opposite of the Engulfing Bullish formation. Three criteria establish an Engulfing Bearish formation:

*The market has to be in a clearly definable up-trend, even if the trend is short term.

*Of the 2 candlesticks in the formation, the second candle’s real body must engulf the first candle’s real body.

*The second real body of the formation should be “down” while the first real body should be “up.”


2. Engulfing Bullish

The Engulfing Bullish formation is, of course, a bullish formation and therefore its symbol (EG) will always appear at the bottom of the formation. It represents the opposite of the Engulfing Bearish formation. Three criteria establish an Engulfing Bullish formation:

*The market has to be in a clearly definable downtrend, even if the trend is short term.

*Of the 2 candlesticks in the formation, the second candle’s real body must engulf the first candle’s real body.

*The second real body of the formation should be “up” while the first real body should be “down.”
 

824


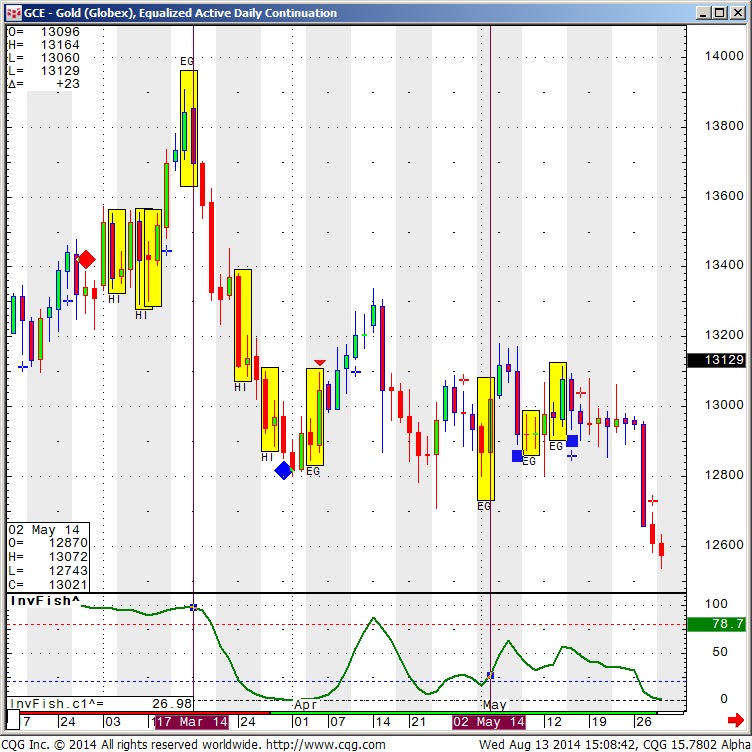
Above is a daily chart of Gold futures, going back to March 17th 2014 where one can see a good example of the ” Bearish EG”  formation and yet in the same exact chart you can see a failed “Bullish EG” formation on May 2nd 2014.


Will continue and explore a few other candlesticks formations over the next couple of weeks.

Continue reading “Gold Daily Continuation Chart – Levels & Reports 8.14.2014”

E-Mini S&P Daily Chart & Economic Reports 6.20.2014

Connect with Us! Use Our Futures Trading Levels and Economic Reports RSS Feed.

Like us on FacebookFollow us on TwitterView our profile on LinkedInFind us on Google+Cannon Trading Futures Trading Resistance & Support Levels and Economic ReportsFind us on Yelp

1. Market Commentary
2. Futures Support and Resistance Levels – S&P, Nasdaq, Dow Jones, Russell 2000, Dollar Index
3. Commodities Support and Resistance Levels – Gold, Euro, Crude Oil, T-Bonds
4. Commodities Support and Resistance Levels – Corn, Wheat, Beans, Silver
5. Futures Economic Reports for Friday June 20, 2014

Hello Traders,

For 2014 I would like to wish all of you discipline and patience in your trading!


I was asked to share my daily chart based on the September contract which is the front month.

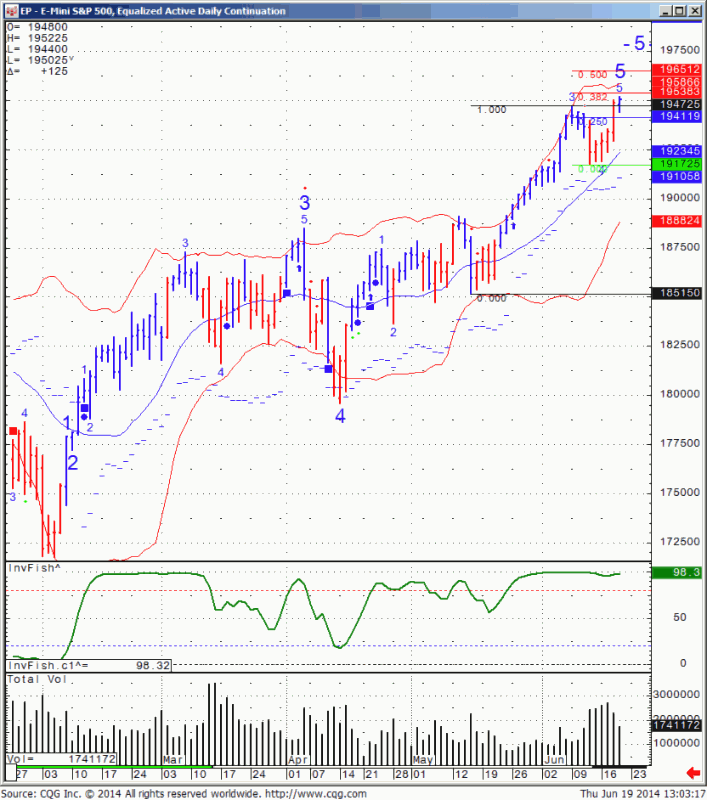
Here is the daily chart of the Sept. mini SP 500 for your review, along with indicators I like to watch and possible levels. Notice that other than a couple of “small red dots” ( which are small sell signal based on Bollinger bands) I have not gotten a sell signal on this market since beginning of January this year!! This market is over extended but I think patience is a virtue especially when a market is making all time highs…..

818


If you like the information we share? We would appreciate your positive reviews on our new yelp!! Continue reading “E-Mini S&P Daily Chart & Economic Reports 6.20.2014”

Memorial Day Futures Trading Schedule & Minutes of Fed Reserve Report by Pedro Nicolaci da Costa 5.22.2014

Connect with Us! Use Our Futures Trading Levels and Economic Reports RSS Feed.

Like us on FacebookFollow us on TwitterView our profile on LinkedInFind us on Google+Cannon Trading Futures Trading Resistance & Support Levels and Economic ReportsFind us on Yelp

1. Market Commentary
2. Futures Support and Resistance Levels – S&P, Nasdaq, Dow Jones, Russell 2000, Dollar Index
3. Commodities Support and Resistance Levels – Gold, Euro, Crude Oil, T-Bonds
4. Commodities Support and Resistance Levels – Corn, Wheat, Beans, Silver
5. Futures Economic Reports for Thursday May 22, 2014

Hello Traders,

For 2014 I would like to wish all of you discipline and patience in your trading!


Memorial Day Weekend is right around the corner!!

Holiday schedule is now available.

Key Passages: Read the Federal Reserve Meeting Minutes in Just a Minute — WSJ Blog

05/21/2014 13:01

By Pedro Nicolaci da Costa
Minutes of the Federal Reserve’s April 29-30 meeting showed policy makers are still hoping for stronger economic growth in the second half of the year. The economic assessment of Federal Open Market Committee participants emphasizes the central bank is so far sticking to its forecasts.
Here are some key excerpts, with quotes in italics:
“In their discussion of the economic situation and the outlook, meeting participants generally indicated that their assessment of the economic outlook had not changed materially since the March meeting. Severe winter weather had contributed to a sharp slowing in activity during the first quarter, but recent indicators pointed to a rebound and suggested that the economy had returned to a trajectory of moderate growth.”
However, that passage is quickly peppered with a note of caution:
“Some participants remarked that it was it was too early to confirm that the bounceback in economic activity would put the economy on a path of sustained above-trend economic growth. In general, participants continued to view the risks to the outlook for the economy and the labor market as nearly balanced. However, a number of participants pointed to possible sources of downside risk to growth, including a persistent slowdown in the housing sector or potential international developments, such as a further slowing of growth in China or an increase in geopolitical tensions regarding Russia and Ukraine.”
In addition, officials seem to have spent quite a bit of time discussing a flagging housing sector, which is key to the economic recovery from the Fed’s perspective.
“Most participants commented on the continuing weakness in housing activity. They saw a range of factors affecting the housing market, including higher home prices, construction bottlenecks stemming from a scarcity of labor and harsh winter weather, input cost pressures, or a shortage in the supply of available lots.”
On the policy front, there was agreement about reducing the pace of monthly bond purchases further in incremental, $10 billion steps. The Fed also had an extensive discussion about its plans for exiting its extraordinary low-interest rate policies. The strategy is still evolving as policy makers assess which tools might work best when the time comes to begin tightening monetary policy.
“Participants considered how various combinations of tools could have different implications for the degree of control over short-term interest rates, for the Federal Reserve’s balance sheet and remittances to the Treasury, for the functioning of the federal funds market, and for financial stability in both normal times and in periods of stress. Because the Federal Reserve has not previously tightened the stance of policy while holding a large balance sheet, most participants judged that the Committee should consider a range of options and be prepared to adjust the mix of its policy tools as warranted. Participants generally favored the further testing of various tools, including the [Term Deposit Facility], to better assess their operational readiness and effectiveness.”
And, there’s more where that came from:
“No decisions regarding policy normalization were taken; participants requested additional analysis from the staff and agreed that it would be helpful to continue to review these issues at upcoming meetings.”

More at The Wall Street Journal’s Real Time Economics blog,http://blogs.wsj.com/economics/


If you like the information we share? We would appreciate your positive reviews on our new yelp!! Continue reading “Memorial Day Futures Trading Schedule & Minutes of Fed Reserve Report by Pedro Nicolaci da Costa 5.22.2014”

How to Trade Copper Futures

Copper Futures Trading is one of the most popular vehicles in the industrial metals market. Copper is used in a wide variety of markets such as construction, plumbing, manufacturing and architecture. With such a wide array of usages, trading copper offers many opportunities for gain. More and more investors are looking to raw commodities as trading vehicles as they provide more liquidity and volatility within their respective markets. Trading raw commodities as futures contracts also allows for better price transparencies.

Copper is usually a great indicator of economic growth within a region. As the demand for copper rises, the more valuable the commodity becomes given its vital contributions to industrial and urban development. Worldwide copper consumption has been on the steady rise since 2011, with China being the world’s top copper consumer. Industrial copper producing companies use the futures market to hedge against losses and for price mitigation. Investors generally use the copper futures market to leverage their capital against price fluctuations to generate returns on their investments.

A copper futures contract represents 25,000 pounds of copper. Standard trading hours operate from Sunday through Friday beginning at 6:00 p.m. until 5:15 p.m. the following day Central Standard Time, allowing a 23 hour trading platform. The 45 minute break allows for the close out on the previous day’s results. Trading in copper futures requires paying close attention to market fluctuations and remaining active on developing markets. Because copper moves within the market at high volatility, neglecting a position for even a short period of the day can be very costly. Below are a few of the most popular exchanges copper futures trade on:

Continue reading “How to Trade Copper Futures”

Futures Levels & Economic Reports 3.26.2014

Connect with Us! Use Our Futures Trading Levels and Economic Reports RSS Feed.

Like us on FacebookFollow us on TwitterView our profile on LinkedInFind us on Google+Cannon Trading Futures Trading Resistance & Support Levels and Economic ReportsFind us on Yelp

1. Market Commentary
2. Futures Support and Resistance Levels – S&P, Nasdaq, Dow Jones, Russell 2000, Dollar Index
3. Commodities Support and Resistance Levels – Gold, Euro, Crude Oil, T-Bonds
4. Commodities Support and Resistance Levels – Corn, Wheat, Beans, Silver
5. Futures Economic Reports for Wednesday March 26, 2014

Hello Traders,

For 2014 I would like to wish all of you discipline and patience in your trading!

The importance of a positive state of mind when trading….is HUGE….
I have seen it when helping clients, interacting with online clients and most of all with myself.
When I let the market or surrounding elements take me out of my focus and allow frustration to take control, the results can be dangerous….an example might be getting stopped out on a short crude trade at the high of the day just to see the market reverses fast and strong….A client may get frustrated because of margin calls or other issues.
It may even be elements outside of trading, such as family, phone calls or just feeling stressed for non trading related issues.
The result of all of the above ends up being poor decision making, trading with frustration, low thresh hold for mistakes and much more.
What is the solution? I do not have one but recognizing that you are trading with the wrong frame of mind or frustration is a good first step. Taking a small break from the screen and putting things in a bigger perspective is a good second step. Deep breaths and a quick time out never hurt anyone either…..

Hope that by sharing this I may help you the next time frustration is about to take over….. Continue reading “Futures Levels & Economic Reports 3.26.2014”

How Crude Oil Prices Affect Gas Prices

There are a few different aspects that factor into how crude oil prices affect what consumers pay at the pump. Oil is directly affected by geopolitical events, weather patterns, distribution costs, supply, demand and State and Federal taxes, to name a few. As the aforementioned forces are unpredictable and as they become more volatile, so becomes crude oil. Understanding each factor and the role it plays with respects to the rise and fall in prices, may help someone understand how to utilize the information to make better trading decisions.

Supply

First and foremost supply is affected by various socioeconomic and political factors within and around the region of origin. Also, OPEC, an organization commenced in 12 of the top oil producing companies and producing just fewer than 50% of the world’s oil supply, regulate their portion of crude oil produced. Often OPEC will be in positions to sell or barter away the oil they produce in exchange for currency or other assets that will benefit their interests. The United States itself houses around 700 million barrels in its Strategic Petroleum Reserves for use in the event of political dissensions with oil producing nations, as well as for emergencies such as natural disaster affected regions of the country.

Demand

The driving forces behind the demand for crude oil can be a number of factors. The most obvious, of course, is the rate and amount of oil each country uses. According to the CIA World Fact book, the United States tops of the market at 21%, the EU uses 15% of the world’s oil and China consumes 11%. As countries develop, particularly within their middle class infrastructure, this creates more consumers and more consumers using vehicles, driving the demand higher. On the back end of developments like this, oil refineries must adjust production to suit the growing need, which also incurs a higher cost in that production.

Continue reading “How Crude Oil Prices Affect Gas Prices”

Futures Trading Levels & Economic Reports 2.27.2014

Connect with Us! Use Our Futures Trading Levels and Economic Reports RSS Feed.

Like us on FacebookFollow us on TwitterView our profile on LinkedInFind us on Google+Cannon Trading Futures Trading Resistance & Support Levels and Economic ReportsFind us on Yelp

1. Market Commentary
2. Futures Support and Resistance Levels – S&P, Nasdaq, Dow Jones, Russell 2000, Dollar Index
3. Commodities Support and Resistance Levels – Gold, Euro, Crude Oil, T-Bonds
4. Commodities Support and Resistance Levels – Corn, Wheat, Beans, Silver
5. Futures Economic Reports for Friday February 28, 2014

Hello Traders,

For 2014 I would like to wish all of you discipline and patience in your trading!

Here are the current front months, active months for the more popular futures contracts. I will send a separate, special notice before stock index futures roll over in two weeks:


  • Stock index ( mini SP, mini Russell etc.) MARCH
  • Financials ( bonds, 10 years etc.) JUNE
  • Crude oil, Natural gas other energies: APRIL
  • Gold: APRIL
  • Silver, copper: MAY
  • Beans, wheat, corn and other grains: MAY
  • Currencies ( euro, yen, Swiss etc.) MARCH
  • Coffee, Cocoa, Sugar, Cotton: MAY
  • Meats ( cattle, hogs) APRIL

Continue reading “Futures Trading Levels & Economic Reports 2.27.2014”