Tuesday Morning Support and Resistance Numbers –Welcome Back!

Here’s a morning cup o’ joe for all you futures traders, our morning support and resistance levels. Good trading!

divider black 190

Support and Resistance Levels – S&P 500, Nasdaq 100, Dow Jones, Mini Russell 2000, 30-Year US Bond, 10-Year US Note

Contract (Dec. 2011) Mini S&P 500 Mini Nasdaq 100 Dow Jones Mini Russell 2000 30-Year US Bond 10-Year US Note
Resistance Level 3——————————————

Resistance Level 2

——————————————

Resistance Level 1

——————————————

Support Level 1

——————————————

Support Level 2

——————————————

Support Level 3

1289.25 

1280


1276


1266


1261.5


1257

2345 

2324


2317


2295


2278


2250

12603 

12458


12388


12206


12110


12024

768.4 

763.8


759


752.2


748.50


742.00

14415 

14400


14323


14306


14213


14128

13107.5 

13030.5


13025


13016.5


13011


12925.5

Continue reading “Tuesday Morning Support and Resistance Numbers –Welcome Back!”

10 minute chart of the Crude Oil market | Support and Resistance Levels

Jump to a section in this post:
1. Market Commentary
2. Support and Resistance Levels – S&P, Nasdaq, Dow Jones, Russell 2000
3. Support and Resistance Levels – Gold, Euro, Crude Oil, T-Bonds
4. Support and Resistance Levels – March Corn, March Wheat, Jan Beans, March Silver
5. Economic Reports for Monday, December 19, 2011

divider black 190

1. Market Commentary

Front month for stock indices, currencies, grains and most active markets is now MARCH. Symbol for March is H

Gold front month is February and Crude Oil front Month will be February this Monday.

If you are not sure which month you should be trading, please contact your broker.

Another trading day brings me to a different topic.

Most of our clients trade stock index futures, like mini SP 500, Mini Russell, Mini Dow Jones futures as well as the DAX and eurostoxx over at Europe ( which appeal to some traders because of the different times these markets are active) etc.

Even within this market group, different markets will behave differently because of difference in the underlying product as well as volume and more. Example the mini Russell 2000 versus the mini SP500.

The mini Russell is a little more “erratic”, bigger, spikier, quicker moves. Mainly because it has less volume than the mini SP 50 but also because the cash index includes the 500 SP stocks plus additional 1500 stocks….

With the growth of electronic trading, volume in Grains, interest rates, currencies, metals, energies and other segments have grown enough that many of these markets are “suitable” for day-trading.

The following is a small list of markets you may want to follow, trade in demo and consider for your day-trading. Another point to keep in mind that some of these markets have lower exchange fees, hence your total transaction costs can be lower!

Indices as discussed above

Currencies ( Euro, Yen, British Pound, Canadian Dollar, Australian dollar)

Interest rates ( US bonds/ 30 years, Ten Years, Five years and even the ULTRA bond contract is picking up volume)

Energies ( mostly Crude oil and Natural gas)

Metals ( gold and silver)

Grains ( beans, corn and wheat)

So the main point I am trying to make today is that there are other markets you may want to look at for day-trading. Some markets fit some traders better because maybe they “respect the trend better”, maybe less volatile or simply because they just are a better match for the trader’s personality on the other side. Some markets are more suitable for “trend following” intraday techniques, while other maybe better for counter trend trading style.

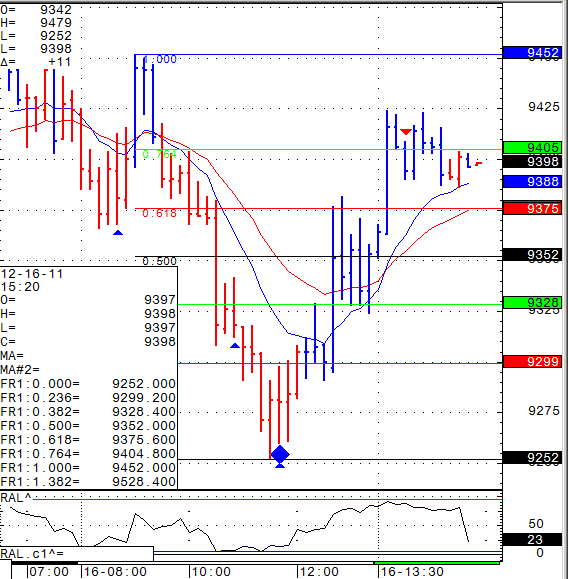
Below you will see a 10 minute chart of the Crude Oil market as an example for a market with wide ranges and volatile moves.
476 Continue reading “10 minute chart of the Crude Oil market | Support and Resistance Levels”

Crude Oil Inventory Economic Report | Support and Resistance Levels

In this post:

1. Support and Resistance Levels
2. Economic Reports
3. Highlighted Earnings Releases

divider black 190

1. SUPPORT AND RESISTANCE LEVELS!

Contract (Sept. 2011) SP500 (big & Mini) Nasdaq100 (big & Mini) Dow Jones (big & Mini) Mini Russell
Resistance 3 1225.33 2301.00 11802 744.90
Resistance 2 1211.92 2262.25 11609 726.70
Resistance 1 1204.83 2242.25 11509 717.20
Pivot 1191.42 2203.50 11316 699.00
Support 1 1184.33 2183.50 11216 689.50
Support 2 1170.92 2144.75 11023 671.30
Support 3 1163.83 2124.75 10923 661.80


Contract Dec. Gold Sept. Euro Oct. Crude Oil Dec. Bonds
Resistance 3 1889.2 1.4328 94.26 141 9/32
Resistance 2 1865.0 1.4239 92.00 140 26/32
Resistance 1 1842.2 1.4170 90.67 140 4/32
Pivot 1818.0 1.4081 88.41 139 21/32
Support 1 1795.2 1.4012 87.08 138 31/32
Support 2 1771.0 1.3923 84.82 138 16/32
Support 3 1748.2 1.3854 83.49 137 26/32

divider black 190

2. Economic Reports Thursday September 8th, 2011

Trade Balance
8:30am USD

Unemployment Claims
8:30am USD

Natural Gas Storage
10:30am USD

Crude Oil Inventories
11:00am USD

Fed Chairman Bernanke Speaks
1:00pm USD

Consumer Credit m/m
3:00pm USD

President Obama Speaks
7:00pm USD

Economics Report Source: http://www.forexfactory.com/calendar.php

divider black 190

3. Today’s Highlighted Earnings Releases

SYMBOL COMPANY EVENT TITLE EPS ESTIMATE EPS ACTUAL PREV. YEAR ACTUAL DATE/TIME (ET)
A9I.I Agi Therapeutics PLC Interim 2011 Agi Therapeutics PLC Earnings Release n/a n/a n/a 7-Sep
CNU Continucare Corp Q4 2011 Continucare Corp Earnings Release $ 0.11 n/a $ 0.09 7-Sep BMO
FCE.A Forest City Enterprises Inc Q2 2011 Forest City Enterprises Inc Earnings Release $ 0.37 n/a $ 0.54 7-Sep AMC
HW.TO Harry Winston Diamond Corp Q2 2012 Harry Winston Diamond Corp Earnings Release n/a n/a n/a 7-Sep AMC
HITK Hi-Tech Pharmacal Co Inc Q1 2012 Hi Tech Pharmacal Co Inc Earnings Release $ 0.84 n/a $ 0.67 7-Sep BMO
SEAC SeaChange International Inc Q2 2012 SeaChange International Inc Earnings Release $ 0.16 n/a $ 0.11 7-Sep AMC

Futures Trading Levels, Crude Oil Tumbles in Light of OPEC and IEA News

Cannon Trading / E-Futures.com

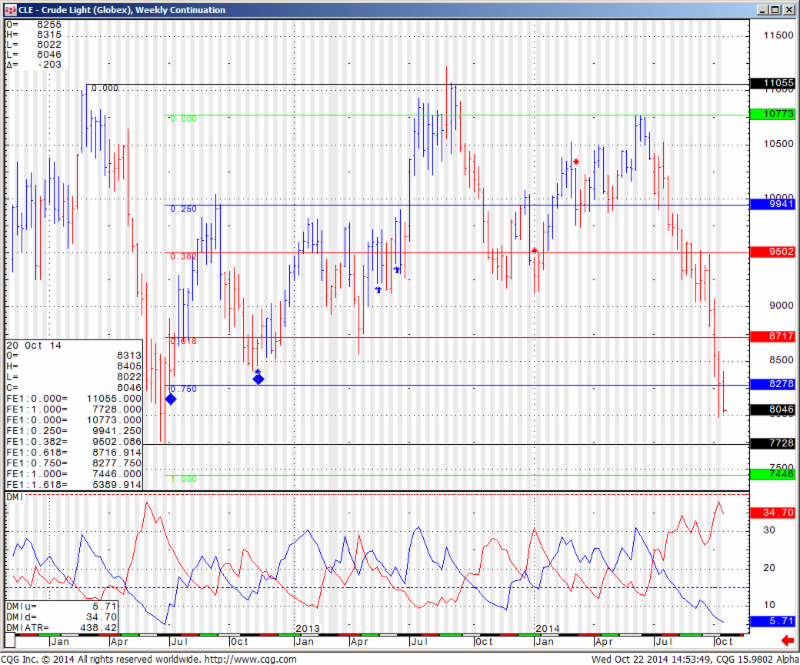
Overnight news sent crude oil tumbling….I thought it would be interesting to share a weekly chart of Crude Oil futures for your review.

The International Energy Agency will release 60 million barrels of oil from strategic government stockpiles held by industrialized consumer nations in a bid to push down oil prices, the 28-member group announced on Thursday.

The announcement comes after OPEC failed to raise production at a meeting on June 8 and despite assurances from OPEC’s biggest producer Saudi Arabia that it would lift supplies unilaterally.

Weekly Crude Oil Futures Chart: June 23rd 2011

Weekly Crude Oil Futures Chart levels for Wednesday June 23rd, 2011

Continue reading “Futures Trading Levels, Crude Oil Tumbles in Light of OPEC and IEA News”

Futures Trading Levels, Crude Oil as a Leader of Commodity Prices

Cannon Trading / E-Futures.com

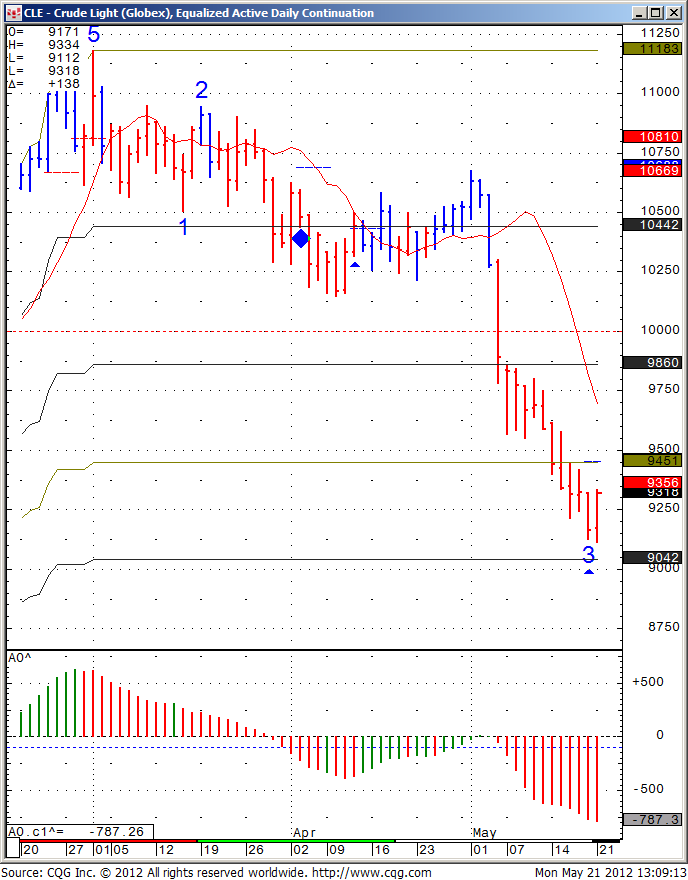
Crude Oil has been moving the rest of the commodities sector the last few months and has influence on all futures.

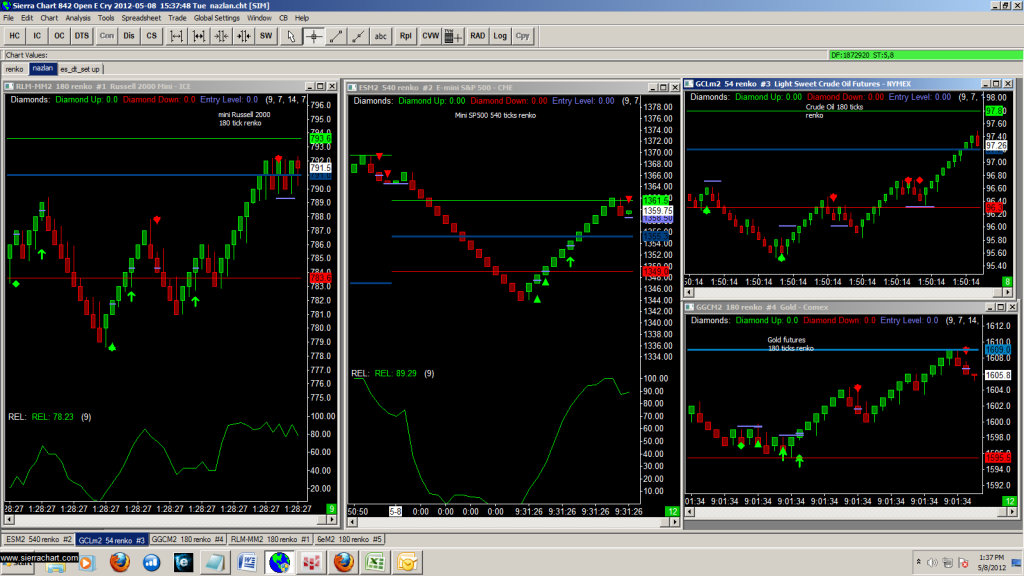
Thought I would share a daily chart for review, along with a screen shot of the crude oil set ups I share in my daily live day-trade signals service.

As far as longer term direction for crude, I will need to see which level we can break out first, 104.91 on the upside or 94.54 on the downside. In between, you have wide 410 trading range ( equal to $10,000 per one contract against you or in your favor….)

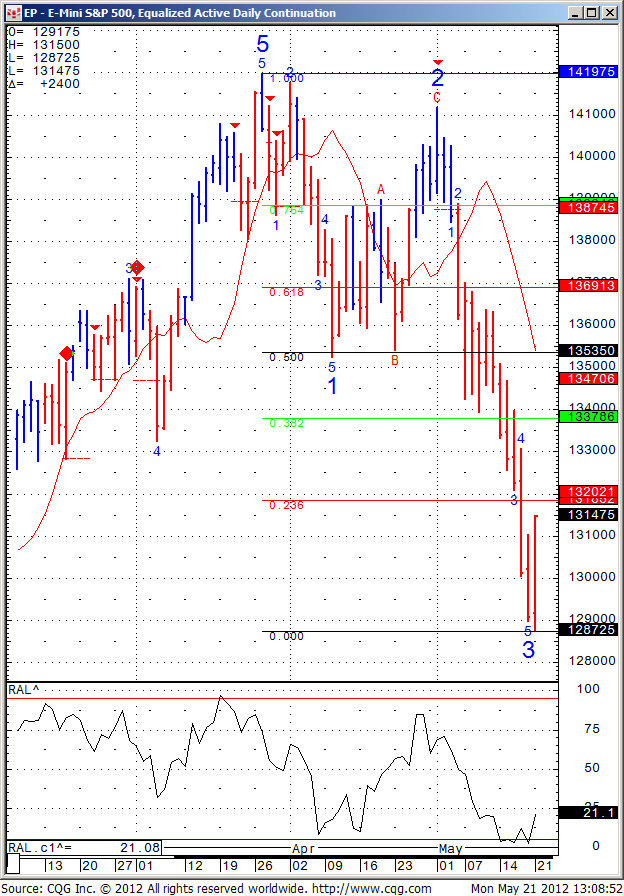
Daily mini S&P trading chart screenshot from today June 6th, 2011

Stock futures trading chart levels for Monday June 6th, 2011

Intra-day trading chart screenshot from today June 6th, 2011

Intra-day chart: (blue diamond = potential buy, red diamond = potential sell)

Stock futures trading chart levels for Monday June 6th, 2011 Continue reading “Futures Trading Levels, Crude Oil as a Leader of Commodity Prices”

Futures Trading Levels, Market Consolidation and Crude Oil Inventories

Cannon Trading / E-Futures.com

Yesterday I wrote:

“If we break todays low of 1310.75, I will favor a move down to 1290. On the other hand if we can hold this level, we may see a bounce to 1326”.

Well…..we had an inside day trading within the range of the previous day, that means market took a bit to consolidate before deciding on the next leg. The Million $$ question is which way…..so far we have been making lower lows and lower highs over the past couple of weeks

Daily chart of Mini SP 500 along with some levels to be aware of, for your review below: Continue reading “Futures Trading Levels, Market Consolidation and Crude Oil Inventories”

Futures Trading Levels, Crude Oil Performance

Cannon Trading / E-Futures.com

Below you will see two different tables for Crude Oil since we are now executing the system for more than a few clients, using two different trading engines with two different clearing house. Since the system is only executed “semi Automatically” you will see some differences in the results. This is simply part of REAL LIVE, REAL TIME TRADING versus hypothetical trading. In hypothetical trading and/or back testing, computers assume perfect conditions, getting filled on all limit orders etc.
in REAL LIVE trading, there are times when you limit gets hit but you don’t get filled, there is room for human or machine errors etc.

NET RESULTS AFTER COMMISSIONS BELOW:

Group A:
Commodity Futures trading levels Oil March 31th, 2011
Group B:
Commodity Futures trading levels Oil March 31th, 2011

* Past performance is not indicative of future results.

About NZL Crude Oil Day-Trading system:

The computerized trading system, “NZL-Crude Oil Day Trading” is based on a mathematical algorithm that tries to identify exhaustion in either selling or buying along with a possible short term trend reversal. This system trades the Crude Oil future contract only. The system uses volume charts to determine entry and exit ( rather than the more familiar time charts). The algorithm takes into consideration volume, momentum and speed of market in an attempt to recognize situation where “fear and greed” are at extremes. It is followed by measuring possible targets for profits along with stops. This specific system takes the approach that statistically the percent of winning trades is larger than losing trades but in return it uses larger stops than targets.

We recommend $7500 of risk capital per 1 contract traded

Futures and options trading is risky and not suitable for everyone. There is a substantial risk of loss in trading commodity futures, options and off-exchange foreign currency products.
Past performance is not indicative of future results. Continue reading “Futures Trading Levels, Crude Oil Performance”

Futures Trading Levels, Crude Oil Leading Commodity Markets

Cannon Trading / E-Futures.com

With the Mid East situation, Crude Oil has been the leader of the commodities markets affecting movements in markets like metals, stock indices and more.

Daily chart of Crude oil for your review below along with a small picture that expresses what one can expect of tomorrow’s unemployment report better than I can…..
Either way, higher volatility, wider ranges = trader must asses their daily risk settings, their stops/ targets per trade, trading size etc.

Daily E-Mini S&P 500 Futures Trading Chart

Stock futures trading chart levels Friday March 4th 2011
Continue reading “Futures Trading Levels, Crude Oil Leading Commodity Markets”