Sugar Futures Daily Chart Review & Futures Levels 12.08.2020

_________________________________________________

Voted #1 Blog and #1 Brokerage Services on TraderPlanet for 2016!!  

_________________________________________________

Dear Traders,

Like us on FaceBook!
Get Real Time updates and market alerts on Twitter!
Sugar daily chart below. Sugar futures have good volume and in my opinion are a good market for swing trading type of activity.
Sugar is traded on ICE so real-time quotes are not as easily obtained.
Sugar futures got a little sweeter these past few weeks, mainly due to US$ weakness.
Current levels to try an evaluate if this pullback is a pullback or more…
1413 is next major support basis the March Contract.
f600d9d2 a801 43e7 a1e1 9ab1611a27b6

Good Trading

Trading Futures, Options on Futures, and retail off-exchange foreign currency transactions involves substantial risk of loss and is not suitable for all investors.  You should carefully consider whether trading is suitable for you in light of your circumstances, knowledge, and financial resources. You may lose all or more of your initial investment. Opinions, market data, and recommendations are subject to change at any time when it comes to Futures Trading.


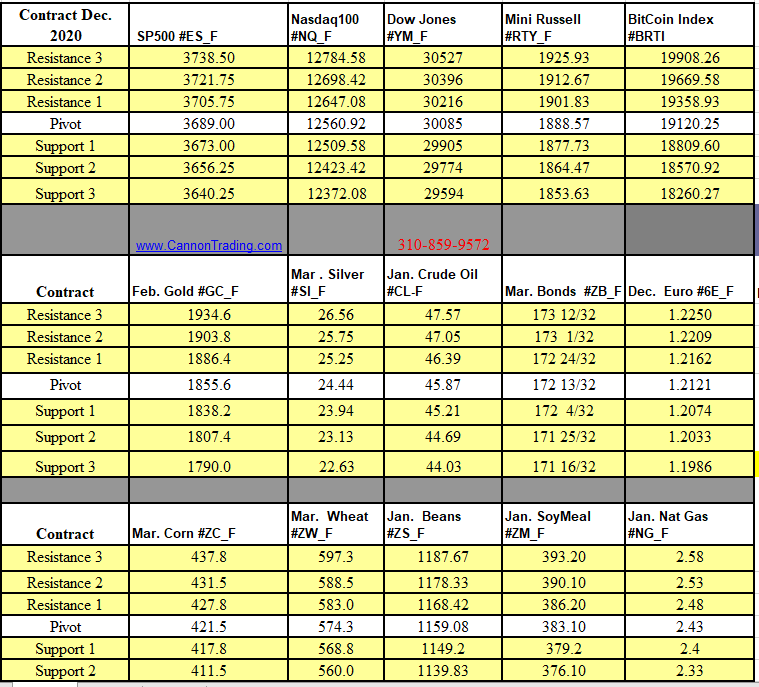
Futures Trading Levels

12-08-2020

b7428a33 e314 48f7 a043 c8712935fdb4

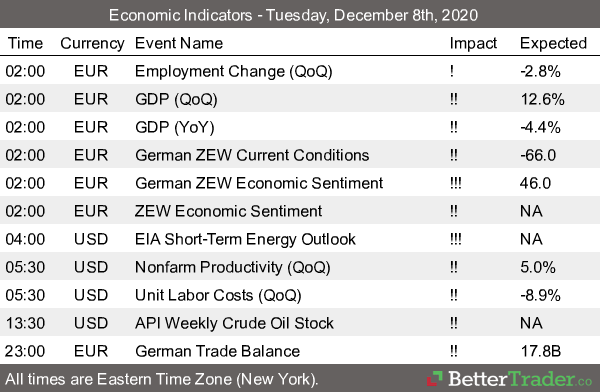
Economic Reports, source: 

 www.BetterTrader.co

fc4165f6 ed55 469b 916d 39be3669b29d

This is not a solicitation of any order to buy or sell, but a current market view provided by Cannon Trading Inc. Any statement of facts here in contained are derived from sources believed to be reliable, but are not guaranteed as to accuracy, nor they purport to be complete. No responsibility is assumed with respect to any such statement or with respect to any expression of opinion herein contained. Readers are urged to exercise their own judgement in trading.

30 Year Treasury Notes (ZB) 120min Chart & Futures Levels 12.03.2020

_________________________________________________

Voted #1 Blog and #1 Brokerage Services on TraderPlanet for 2016!!  

_________________________________________________

Dear Traders,

Like us on FaceBook!
Get Real Time updates and market alerts on Twitter!
Each market has a different personality, different behavior along with different times of the day when it is most active. If you are finding that the ES (mini SP) is not giving you enough risk/opportunities then start monitoring a couple of other markets and perhaps explore them in demo / simulated mode.
I think that there are more than a few markets that are suitable for day-trading. Below you will find some observations, tips along with what are unique about these markets, personality and most active trading hours (interest rates, mostly the ten year and 30 year).
In most platforms, the symbols are ZB for 30 year bonds and ZN for 10 year notes.
Product Symbol
ZB
Contract Size
The unit of trading shall be U.S. Treasury Bonds having a face value at maturity of one hundred thousand dollars ($100,000) or multiples thereof
Price Quotation
Points ($1,000) and 1/32 of a point. For example, 134-16 represents 134 16/32. Par is on the basis of 100 points.
Product Symbol
ZN
Underlying Unit
One U.S. Treasury note having a face value at maturity of $100,000.
Deliverable Grades
U.S. Treasury notes with a remaining term to maturity of at least six and a half years, but not more than 10 years, from the first day of the delivery month. The invoice price equals the futures settlement price times a conversion factor, plus accrued interest. The conversion factor is the price of the delivered note ($1 par value) to yield 6 percent.
Price Quote
Points ($1,000) and halves of 1/32 of a point. For example, 126-16 represents 126 16/32 and 126-165 represents 126 16.5/32. Par is on the basis of 100 points.
Tick Size
(minimum fluctuation)
One-half of one thirty-second (1/32) of one point ($15.625, rounded up to the nearest cent per contract), except for intermonth spreads, where the minimum price fluctuation shall be one-quarter of one thirty-second of one point ($7.8125 per contract).
Contract Months
The first five consecutive contracts in the March, June, September, and December quarterly cycle.
These contracts are often affected by many of the economic reports that come out at 8:30 AM Eastern and there is very active volume between the hours of 8 AM EST and 3 PM EST
Volume on both contracts is very good. Ten years will often have 1 million contracts traded per day (might be the second most active US futures market after the mini SP 500) and the bonds will avg. around 300,000 contracts.
These markets can experience very volatile movements during and right after different reports but then will often trade smooth or in an intraday trend the rest of the day.
Spread traders may find some interesting strategies trading the ZB/ZN spread or what I refer to as the 30/10 and some call NOB spread ( notes over bonds).
120 minute chart of the ZB or 30 yr bonds for observation below.
7d506575 0831 4be9 a8a3 437fad17c28a

Good Trading

Trading Futures, Options on Futures, and retail off-exchange foreign currency transactions involves substantial risk of loss and is not suitable for all investors.  You should carefully consider whether trading is suitable for you in light of your circumstances, knowledge, and financial resources. You may lose all or more of your initial investment. Opinions, market data, and recommendations are subject to change at any time when it comes to Futures Trading.


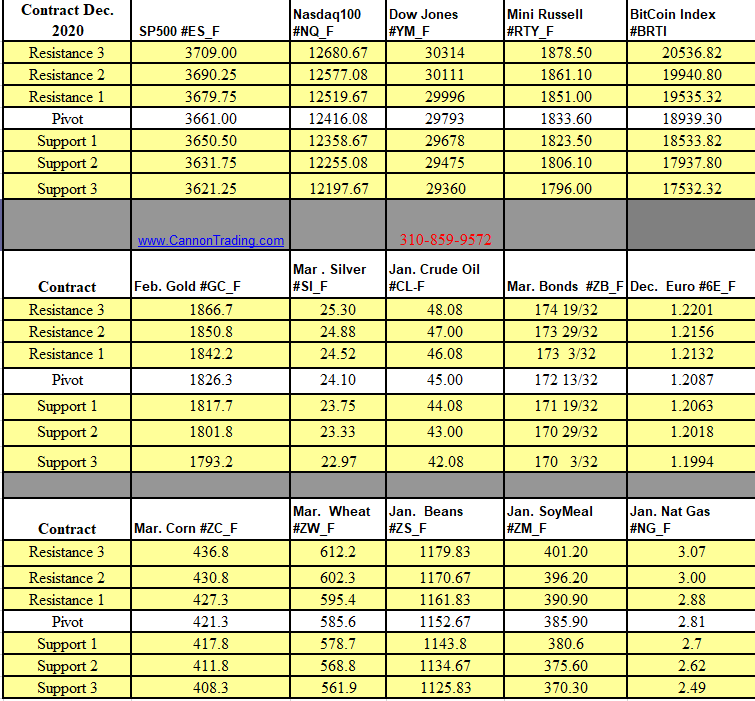
Futures Trading Levels

12-03-2020

9b39af4c 2053 4a58 b21f ffa6fec356c3

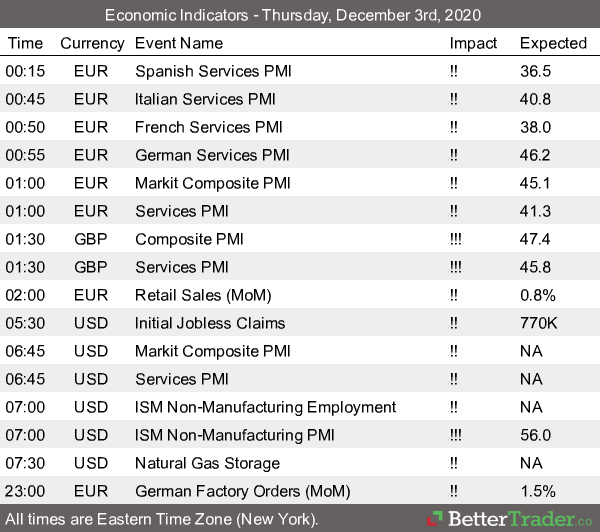
Economic Reports, source: 

 www.BetterTrader.co

9678618a 9013 4ff1 a0ce ab962b46bea8


This is not a solicitation of any order to buy or sell, but a current market view provided by Cannon Trading Inc. Any statement of facts here in contained are derived from sources believed to be reliable, but are not guaranteed as to accuracy, nor they purport to be complete. No responsibility is assumed with respect to any such statement or with respect to any expression of opinion herein contained. Readers are urged to exercise their own judgement in trading.

Futures Trading Levels & Economic Reports for October 17th 2017

Voted #1 Blog and #1 Brokerage Services on TraderPlanet for 2016!! 

_____________________________________________________________

Dear Traders,

I have touched about this topic before in different ways but definitely worth revisiting.

I call it:  “There is more to daytrading futures than the mini SP 500….”

When we first started offering online futures trading, back in 1997, mini SP was the king.

Stock index futures had more volatility, the market was actually moving both up and DOWN..and it was the first electronic contract. 20 years later, there are almost no pits….ALL markets are electronic, stocks been going up, almost in a straight line and we are in zero rates/ zero volatility type of environment. I am sure this will change, big question is when.

Until it does….if you have not already done so here are a few pointers I am throwing at you for further thought, exploration:

  1. Crude oil, gold are quite a bit more volatile and move both up and down. Take a look, try in demo mode.
  2. Bonds and grains offer different type of personality than some of the other markets. Again, try it in demo mode, learn contract specs and behavior.
  3. Weekly options are now available on major markets. I like some of the advantages these options have offer straight futures as well as the combination one can use. Read more here.
  4. There new contracts ( some are not that new but worth mentioning) VIX futures are an interesting product. Currency futures been around for years and are a better vehicle in my opinion than FOREX.
  5. Consider adding automated systems to your portfolio.

I am sure there is more but hope these few pointers will help you explore trading the right way. Continue reading “Futures Trading Levels & Economic Reports for October 17th 2017”

8 Steps to Day Trading Futures 5.23.2017

Connect with Us! Use Our Futures Trading Levels and Economic Reports RSS Feed.

Like us on FacebookFollow us on TwitterView our profile on LinkedInFind us on Google+Cannon Trading Futures Trading Resistance & Support Levels and Economic ReportsFind us on Yelp  

8 Steps

My name is Ilan Levy-Mayer and I am the Vice President and Senior Futures Broker at Cannon Trading.

I came up with the following personal observations after serving online traders worldwide for more than 18 years.

The following steps are guides to progress, and are not necessarily in sequential order. Some of them are always required, but each futures trader is different and will relate to these stages in their own ways. While attempting to learn and progress, one must keep in mind that futures trading is risky and can involve significant losses. Continue reading “8 Steps to Day Trading Futures 5.23.2017”

Day Trading Stocks vs Futures 2.16.2017

Connect with Us! Use Our Futures Trading Levels and Economic Reports RSS Feed.

Like us on FacebookFollow us on TwitterView our profile on LinkedInFind us on Google+Cannon Trading Futures Trading Resistance & Support Levels and Economic ReportsFind us on Yelp  

____________________________________________________________________

Voted #1 Blog and #1 Brokerage Services on TraderPlanet for 2016!!  

____________________________________________________________________

Day Trading Futures vs. Day Trading Stocks

No Downtick Rule

With Futures there are NO downtick and/or short sale rules as found in daytrading equities. No boxing of positions and no bullets. You can instantly short anytime at any price.

Tax Advantage

Commodities are taxed differently than securities. The net gain or loss from trading commodities is reported on schedule D (capital gains and losses); 60 % of the amount is taxed as a long-term capital gain and 40% is taxed as a short-term capital gain. Active Securities Traders have all gains taxed as short term vs. commodities traders who have the above treatment.

24 Hour Market Access

With Electronic Screen traded E-Mini Contracts you can access the market during regular equity trading hours, after hours and during the night. This makes trading news easier as many news events happen after 3:00 pm and late in the afternoons.

More Leverage

You can control more exposure with the same capital than in equities.

Lower Cost Commissions It costs an average of $5-$9 per ticket to actively trade equities, compared with futures where it is $1.26 to $2.00 per ticket – less than half the price. 

The Catch?

They can be more risky than equities.

Trading the E-Mini futures contracts can be more exciting and faster paced than traditional equity markets day trading. Your emotional swings can be more excessive with futures because they are so much more liquid than the equity markets that you may be used to trading. And you have more leverage to play with. These products are for professionals only. Please read carefully the risk disclosure forms on this site and all of the risk disclosure forms found in your account paperwork before considering trading futures. 

More Trading Education available here!

Continue reading “Day Trading Stocks vs Futures 2.16.2017”

Video on Day Trading Futures 12.07.2016

Connect with Us! Use Our Futures Trading Levels and Economic Reports RSS Feed.

Like us on FacebookFollow us on TwitterView our profile on LinkedInFind us on Google+Cannon Trading Futures Trading Resistance & Support Levels and Economic ReportsFind us on Yelp

  1. Good article: OPEC to Seek More Oil-Output Cuts from Nonmembers
  2. A good video on daytrading  futures using overbought/oversold indicators (crude oil in this case): https://www.youtube.com/watch?v=qhP-mtpTvE4&t=27s
  3. Last but not least,

Don’t forget to vote for us!! It takes 8 seconds, even if you voted before, they allow voting on daily basis!….vote here!

Dont forget to vote for us!! It takes 8 seconds…. vote here!

Continue reading “Video on Day Trading Futures 12.07.2016”

The Power of Diversification When Trading 3.08.2016

Connect with Us! Use Our Futures Trading Levels and Economic Reports RSS Feed.

Like us on FacebookFollow us on TwitterView our profile on LinkedInFind us on Google+Cannon Trading Futures Trading Resistance & Support Levels and Economic ReportsFind us on Yelp

1. Market Commentary
2. Futures Support and Resistance Levels – S&P, Nasdaq, Dow Jones, Russell 2000, Dollar Index
3. Commodities Support and Resistance Levels – Gold, Euro, Crude Oil, T-Bonds
4. Commodities Support and Resistance Levels – Corn, Wheat, Beans, Silver
5. Futures Economic Reports for Tuesday March 8, 2016

Hello Traders,

For 2016 I would like to wish all of you discipline and patience in your trading!

Greetings!

The Power of Diversification When Trading

I believe that if you are only trading (daytrading) one market you may be missing out on diversifying yourself by trading other markets.

Just like if you have a portfolio that is not diversified, you expose yourself to more risk, I think the same holds with futures.

I like to daytrade at least 3 markets or at least follow 3 markets and see which ones offers set ups that I like. If you only trade the ES, you will have many days during the year where there is lower volatility, tight ranges and perhaps just “dead days”. However if you are also following bonds and crude oil you have better chances to get in trade set ups that you prefer. Not only that there are times that one trade will make up for another one that is not going so well etc.

Continue reading “The Power of Diversification When Trading 3.08.2016”

Spotting Clues Day Trading Futures 2.02.2016

Connect with Us! Use Our Futures Trading Levels and Economic Reports RSS Feed.

Like us on FacebookFollow us on TwitterView our profile on LinkedInFind us on Google+Cannon Trading Futures Trading Resistance & Support Levels and Economic ReportsFind us on Yelp

1. Market Commentary
2. Futures Support and Resistance Levels – S&P, Nasdaq, Dow Jones, Russell 2000, Dollar Index
3. Commodities Support and Resistance Levels – Gold, Euro, Crude Oil, T-Bonds
4. Commodities Support and Resistance Levels – Corn, Wheat, Beans, Silver
5. Futures Economic Reports for Tuesday February 2, 2016

Hello Traders,

For 2015 I would like to wish all of you discipline and patience in your trading!

Getting Clues from other markets?

When day-trading a specific market do you only look at the chart for that specific market? maybe you took it a step further and you are viewing multiple time frame charts for the same market which is a good step in my eyes.

Now lets take this even one step further by observing what markets have correlation, direct or inverse to the market you are trading, perhaps this can help you make decisions when trading.

I will give a few examples from my experience:
When I am in a position in the mini SP 500, I will often observe what the bonds are doing ( many times inverse correlation), I will take notice of what the Dow, Russell and NASDAQ are doing as well ( direct correlation)

If I am trading crude oil, I will many times pay attention to what unleaded gas and heating oil are doing (very close, although not direct correlation) as well as what WTI crude is doing.

Continue reading “Spotting Clues Day Trading Futures 2.02.2016”

Futures Trading Levels & Economic Reports 12.04.2014

Hello Traders,

For 2014 I would like to wish all of you discipline and patience in your trading!

Hello Traders,

One way to eliminate fear and greed while day-trading:

Disclaimer

The methods described in this article are for educational purposes only. Past results are not necessarily indicative of future results. The author and the publisher assume no responsibility for your trading results. Trading involves a high degree of risk. No recommendation is being made to buy any stock, commodity, option or other financial instrument. Consult your financial advisor before starting any investment system.

It is a known fact that fear and greed can be one of your worst enemies.

One way I found that helped some clients to deal with the fear and greed and its related cousin, “getting out of winners too soon and staying in losers too long…” is entering multiple contracts when getting into a day-trade.

Obviously, one has to have the appropriate risk capital, margin requirements to do so but the advantage of trading more than one “unit” or splitting your trading size into two or more parts is as such:

If you enter a trade with one contract ( or if you are treating your trading size as one unit, meaning you enter a trade with 4 contracts and exit the trade with 4 contracts, that is considered treating your trading size as one unit), you can face a very quick dilemma, especially when day-trading. You get in and very quickly you are up 2 mini SP points….what do you do? Do you take profit? Bring your stop loss closer? How do you avoid getting out too early or too late?

Continue reading “Futures Trading Levels & Economic Reports 12.04.2014”

Australian Dollar Chart & Economic Reports 11.18.2014

Hello Traders,

For 2014 I would like to wish all of you discipline and patience in your trading!

Hello Traders,

 In the past I shared some markets I like to look at for day trading opportunities when stock index futures are in dead/ manipulated periods….Today I would like to talk a little about the currency futures markets. I personally prefer currency futures over FOREX any day. More than a few reasons but the main ones are: currency futures trade on one, regulated main exchange ( CME) while FOREX trades through different inter banks and other means of transactions that are not necessarily regulated.FOREX are “commission free” but in reality there is a spread built in that dealer marks up each time you buy or sell which makes FOREX more expensive than futures.

The main ones I like to follow are:

The Euro , The Yen, The British Pound, The Australian. All are paired versus the US$.

Each market will have different times of higher volume which can allow for traders in all time zones to pick their market. Simply open an hourly chart, like the example I am showing below of the Australian $ and add the volume indicator to observe what times the market has the most action.

  • 1 Euro tick is $12.50
  • 1 Yen tick is $12.50
  • 1 Aussie tick is $10
  • 1 British tick is $6.25
  • 1 Canadian Dollar tick is $10

Currency futures will often trend better than other segments and will experience different levels of volatility during economic reports in the different parts of the world.

If you plan on following any currencies, start in demo mode, know what reports are coming that affect the specific currency you are trading, take a look at the daily, weekly charts to get a feel and monitor the action for a while.

Any questions and I will be happy to assist.

Continue reading “Australian Dollar Chart & Economic Reports 11.18.2014”