Volatility Continues, ES Chart Review & Support and Resistance Levels 3.04.2021

_________________________________________________

Voted #1 Blog and #1 Brokerage Services on TraderPlanet for 2016!!  

_________________________________________________

Dear Traders,

Like us on FaceBook!
Get Real Time updates and market alerts on Twitter!
Volatility continues. Rates are the driving force now days.
June is now the front month for rates.
May is front month for silver, copper and most grains.
April crude and natural gas. OPEC meeting tomorrow!
Get Real Time updates and more on our private FB group!
Hourly chart of the ES below for your review along with potential levels of support and resistance.
Mini S&P ES Futures 60 minute chart

Good Trading

Trading Futures, Options on Futures, and retail off-exchange foreign currency transactions involves substantial risk of loss and is not suitable for all investors.  You should carefully consider whether trading is suitable for you in light of your circumstances, knowledge, and financial resources. You may lose all or more of your initial investment. Opinions, market data, and recommendations are subject to change at any time when it comes to Futures Trading.


Futures Trading Levels

3-04-2021

Futures Trading Levels 3.04.2021

Economic Reports, source: 

 www.BetterTrader.co

e4d3afc1 6136 4b7e a6f7 ddb032a49be6


This is not a solicitation of any order to buy or sell, but a current market view provided by Cannon Trading Inc. Any statement of facts here in contained are derived from sources believed to be reliable, but are not guaranteed as to accuracy, nor they purport to be complete. No responsibility is assumed with respect to any such statement or with respect to any expression of opinion herein contained. Readers are urged to exercise their own judgement in trading.

3 Different Types of Day Trading Days & Economic Reports 4.22.2015

Connect with Us! Use Our Futures Trading Levels and Economic Reports RSS Feed.

Like us on FacebookFollow us on TwitterView our profile on LinkedInFind us on Google+Cannon Trading Futures Trading Resistance & Support Levels and Economic ReportsFind us on Yelp

1. Market Commentary
2. Futures Support and Resistance Levels – S&P, Nasdaq, Dow Jones, Russell 2000, Dollar Index
3. Commodities Support and Resistance Levels – Gold, Euro, Crude Oil, T-Bonds
4. Commodities Support and Resistance Levels – Corn, Wheat, Beans, Silver
5. Futures Economic Reports for Wednesday April 22, 2015

Hello Traders,

For 2015 I would like to wish all of you discipline and patience in your trading!

Hello Traders,

Many different ways to make and lose money trading futures, even more so when day trading.

Today’s action in crude oil futures led me to write about:

Three main approaches out there in my opinion.

The first is what I call the “trend is your friend”. A trader looks at few different time frames, looking to see if there is an established trend on longer time frame ( example 60 minutes chart) and then trying to look for pull back on lower time frames and “join the trend”. Only works for certain markets and only works few times of the month as most days markets do not have an intraday trend in my opinion.

Second method is what we call break out. Traders will look for markets that have been in a lower volatility situation using indicators such as ADX for example. Then they will look at the chart to find what they feel are levels that if broken can fuel a stronger move in the same direction. These levels can be extracted visually looking at the chart or using highs/ lows of X periods. This method works better on some markets than others. I noticed that crude oil and gold futures tend to have better chances of a continued breakout move than the mini SP 500 for example.

Continue reading “3 Different Types of Day Trading Days & Economic Reports 4.22.2015”

Mini S&P Hits New Highs & Futures Levels & Economic Reports 12.19.2013

Connect with Us! Use Our Futures Trading Levels and Economic Reports RSS Feed.

Like us on FacebookFollow us on TwitterView our profile on LinkedInFind us on Google+Cannon Trading Futures Trading Resistance & Support Levels and Economic ReportsFind us on Yelp

1. Market Commentary
2. Futures Support and Resistance Levels – S&P, Nasdaq, Dow Jones, Russell 2000, Dollar Index
3. Commodities Support and Resistance Levels – Gold, Euro, Crude Oil, T-Bonds
4. Commodities Support and Resistance Levels – Corn, Wheat, Beans, Silver
5. Futures Economic Reports for Thursday December 19, 2013

Hello Traders,

For 2013 I would like to wish all of you discipline and patience in your trading! 

We need your votes!!

I have gotten and getting great feedback from many of you and would appreciate if you can take a couple of seconds to vote at:


Trader Planet Award


Also keep in mind that March is now the front month for stock indices, financials, currencies and grains!
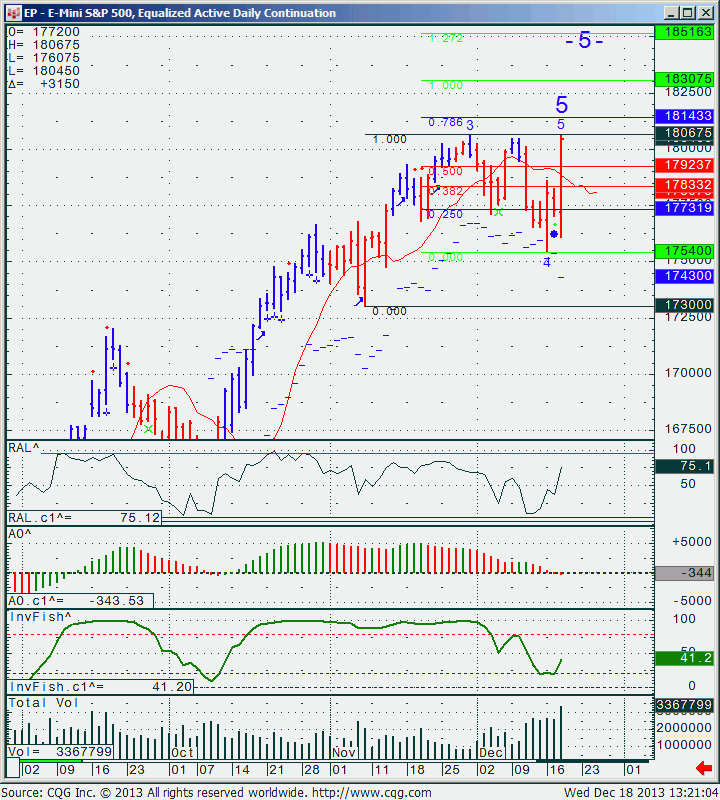
What a wild ride today following the FOMC !!

Two charts for your viewing pleasure….one is an 8 tick range bar of the mini SP. Note it took the market 4 hours to complete the same range ( volume as well) it did in about 2 minutes right after FOMC ( if you read my blog yesterday, you hopefully listened and stayed out of the market during the minutes before and right after as I feel it is a pure gamble) –  so first chart just to demonstrate the volatility after the report.


ESh4 2.00 mg #2 E-Mini SP

Second chart is a daily chart of the March mini SP along with possible levels both above and below.


EP - E Mini S&P 500, Equalized Active Daily Continuation
EP – E Mini S&P 500, Equalized Active Daily Continuation

Continue reading “Mini S&P Hits New Highs & Futures Levels & Economic Reports 12.19.2013”

Mini S&P Daily Chart, Futures Levels & Economic Reports 12.17.2013

Connect with Us! Use Our Futures Trading Levels and Economic Reports RSS Feed.

Like us on FacebookFollow us on TwitterView our profile on LinkedInFind us on Google+Cannon Trading Futures Trading Resistance & Support Levels and Economic ReportsFind us on Yelp

1. Market Commentary
2. Futures Support and Resistance Levels – S&P, Nasdaq, Dow Jones, Russell 2000, Dollar Index
3. Commodities Support and Resistance Levels – Gold, Euro, Crude Oil, T-Bonds
4. Commodities Support and Resistance Levels – Corn, Wheat, Beans, Silver
5. Futures Economic Reports for Tuesday December 17, 2013

Hello Traders,

For 2013 I would like to wish all of you discipline and patience in your trading! 

Busy week ahead! Many diff. reports coming out this week with FOMC decision this Wednesday.

We saw some volatility in the overnight session on the SP 500 but very tight range once the cash market opened.

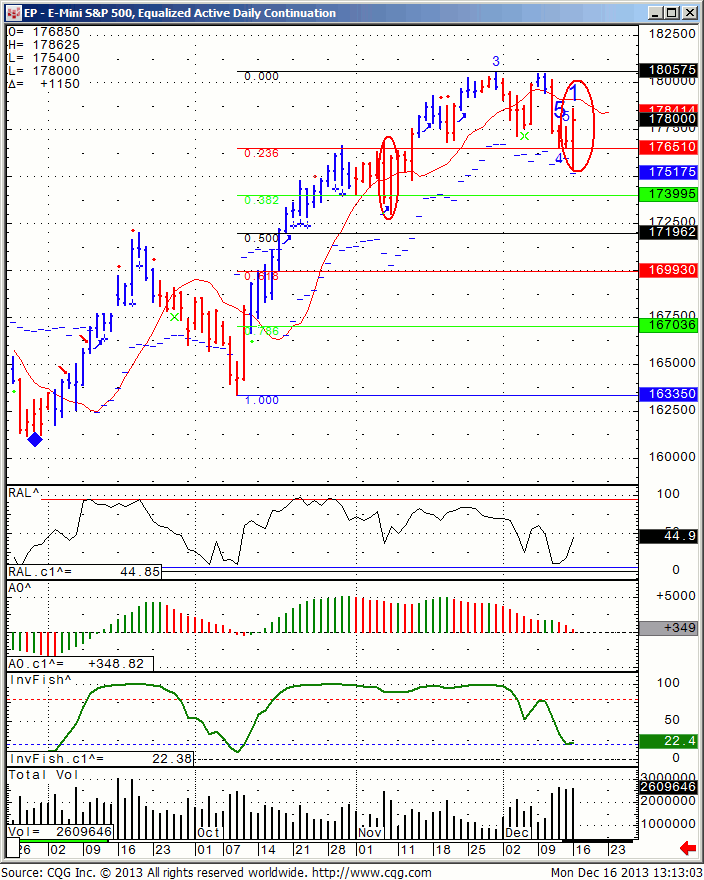
As far as market outlook, we are at a junction again, like we were back on Nov. 8th when the market declined for a bit and then made a new low only to close much higher. We saw similar action today ( I circled both today’s and Nov. 8th ). The big question is if new highs are awaiting or is this is just a bounce. I think answers will come by the end of the week ( might be too late, I wish we knew the answer in advance) but for now I am treating this market as a very wide decision channel between today’s lows at 1754 and recent high at 1805.75 basis the March contract.


Chart for your review below:

EP - E Mini S&P 500, Equalized Active Daily Continuation
EP – E Mini S&P 500, Equalized Active Daily Continuation

New Highs for S&P, Futures Levels & Economic Reports 11.14.2013

Connect with Us! Use Our Futures Trading Levels and Economic Reports RSS Feed.

Like us on FacebookFollow us on TwitterView our profile on LinkedInFind us on Google+Cannon Trading Futures Trading Resistance & Support Levels and Economic ReportsFind us on Yelp

1. Market Commentary
2. Futures Support and Resistance Levels – S&P, Nasdaq, Dow Jones, Russell 2000, Dollar Index
3. Commodities Support and Resistance Levels – Gold, Euro, Crude Oil, T-Bonds
4. Commodities Support and Resistance Levels – Corn, Wheat, Beans, Silver
5. Futures Economic Reports for Thursday November 14, 2013

Hello Traders,

For 2013 I would like to wish all of you discipline and patience in your trading! 


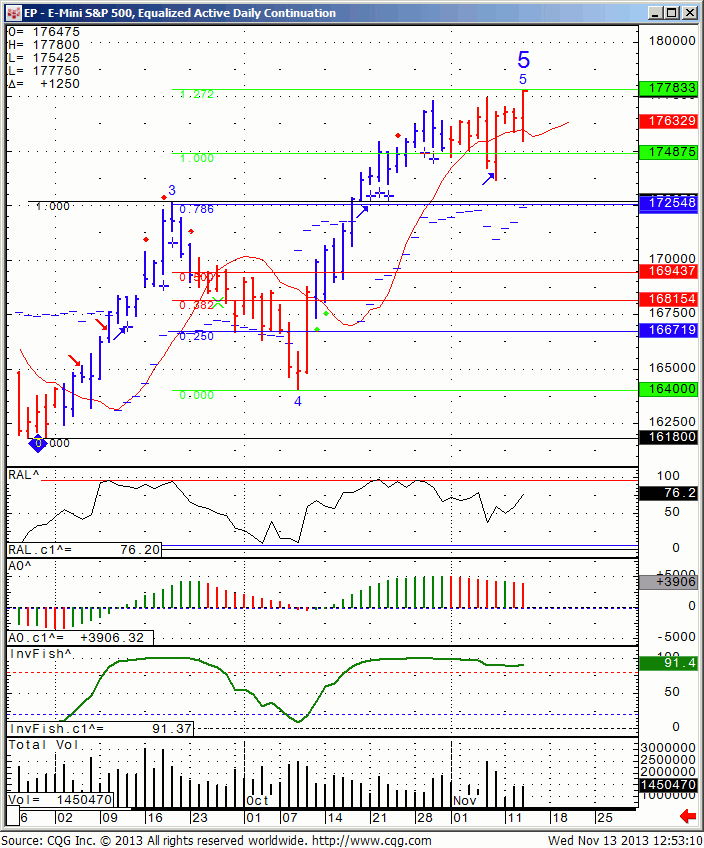
New highs on the SP500…..


I have drawn the extensions in the chart below last week…will be interesting to see if price respects those levels or not…I guess we can find out as early as tomorrow….

EP - E-Mini S&P 500, Equalized Active Daily Continuation
EP – E-Mini S&P 500, Equalized Active Daily Continuation


On a different note:

  • My opinion is that there are 3 main types of trading days.


  1. Most common is two sided trading action with swings up and down – this type of trading day is most suitable for using support and resistance levels along with overbought /oversold indicators.
  2. Strong trending day, mostly one directional – this type of trading day is the least common, many times will happen on Mondays and maybe 3-5 times a month at most – this type of trading day is most suitable for using ADX, MACD crossovers and pretty much looking for pullbacks to jump on the trend.
  3. Slow and/ or choppy trading day – this type of trading day is best suited for taking small profits from the market by looking at volume spikes, using stochastics as possible entry signals and usually wait for a pullback before jumping in.


  • Good question is how can one asses what type of trading day we will have while the market is still trading….I am doing some work about it and will be happy to hear feedback via email but here are some initial observations:
    1. Was the overnight session a wide, two sided trading range? If the answer is yes, good chances for similar trading day during the primary session ( primary session is when the cash/ stock market is open).
    2. Mondays have the highest chance for trending days.
    3. The behavior of the first hour of trading can also suggests the type of action for the rest of the day.
    4. If the first 30 minutes have good volume, better chances for type 1 or type 2 trading days.
    5. low volume during first 30 minutes can suggest a choppy (type 3 trading day).

Continue reading “New Highs for S&P, Futures Levels & Economic Reports 11.14.2013”

E-Mini S&P 500 – Support and Resistance Levels

Jump to a section in this post:
1. Market Commentary
2. Support and Resistance Levels – S&P, Nasdaq, Dow Jones, Russell 2000
3. Support and Resistance Levels – Gold, Euro, Crude Oil, T-Bonds
4. Support and Resistance Levels – March Corn, March Wheat, Jan Beans, March Silver
5.Economic Report for January 26, 2012

1. Market Commentary

FOMC is behind us and below you will find some commentary from WSJ online as well as my daily chart of the Mini SP 500, which like always have at least two scenarios…upside possible targets as well as reversal zones if the market losses momentum..While I think this market may be overbought, I would not look to fight this momentum unless I see signs of buying exhaustion and reversal.
************************************************************
WSJ BLOG/MarketBeat: Today Looks a Lot Like a QE Trade
01/25/12 14:32

(This story has been posted on The Wall Street Journal Online’s Market Beat blog at http://blogs.wsj.com/marketbeat.)

By Min Zeng
US stocks and gold are bouncing, the ten-year Treasury yield is tumbling below 2% again (at least briefly) and the dollar is getting hit — sounds like the typical picture of a QE trade rippling through the financial markets.
Indeed, some market participants are taking today’s dovish FOMC statement as QE-lite.
The key boost for risky assets lies in the Fed’s further extension of its promise to keep its ultra-low target rate into late 2014. That means investors can be assured that the first rate hike won’t come until then or even later.
A bond trader says that the statement signals the Fed is more worried about deflation, which suggests more policy easing to co! me.
“They won’t use the D word but that is what they are thinking,” he says. “Expect QE3 to come.”
The dollar wilts on the dovish Fed, with the euro up 0.4% at $1.309.
Gold, another QE beneficiary, bounced from less than $1660 an ounce before the Fed’s statement to more than $1710 at last check.

EP - E- mini S&P 500, Equalized Active Daily Continuation
EP – E- mini S&P 500, Equalized Active Daily Continuation

Continue reading “E-Mini S&P 500 – Support and Resistance Levels”

Futures Trading Levels & Economic Reports for July 21st 2010

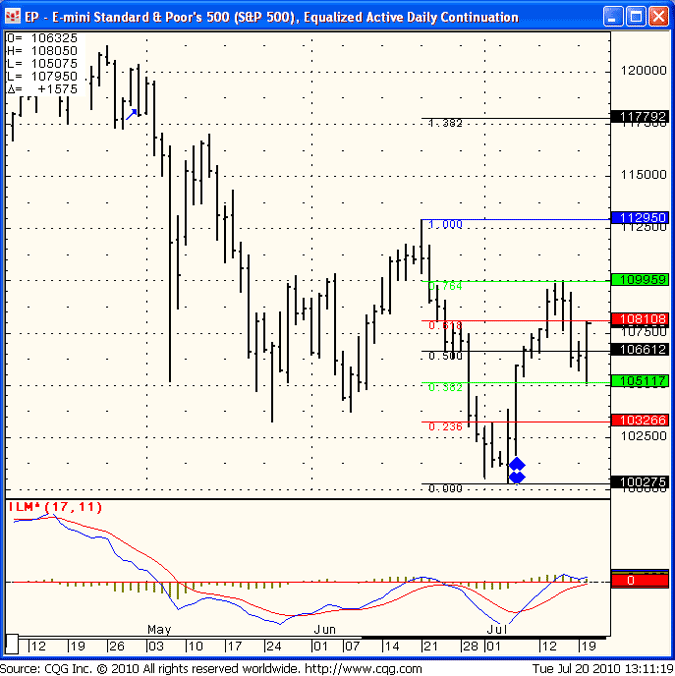
Nice bounce after touching some FIB levels during overnight session/early morning. FIBONACCI levels been providing good support/ resistance levels so far when applied over multiple time frames. ( daily, hourly, 15 minutes etc. )

Below is a daily chart of the E Mini S&P 500 futures contract with FIBONACCI levels drawn.
Notice todays lows and highs.

We are closing against highs and some momentum during the night session can help this market visit 1099. Failure against the 1081 level and we are back to range bound trading.

EP - E Mini Standard & Poor's 500 (S&P), Equalized Active Daily Continuation
EP – E Mini Standard & Poor’s 500 (S&P), Equalized Active Daily Continuation

Continue reading “Futures Trading Levels & Economic Reports for July 21st 2010”

SERVICES
SOFTWARE
Day Trading/Order Flow
COMPANY
QUICK LINKS

Follow Us On Social Media

Cannon Trading Company, Inc., Commodity Broker, Beverly Hills, CA