Trading Levels and Reports for November 27, 2012

Jump to a section in this post:

1. Market Commentary
2. Support and Resistance Levels – S&P, Nasdaq, Dow Jones, Russell 2000, Dollar Index
3. Support and Resistance Levels – Gold, Euro, Crude Oil, T-Bonds
4. Support and Resistance Levels – Corn, Wheat, Beans, Silver
5. Economic Reports for Thursday November 22, 2012


Hello Traders,

Market came back from Thanksgiving Holiday very FULL AND SLOW…low volume, narrow range and not much action as far as day traders are concerned.  I hope we see “normal” volume and wider trading bands tomorrow.


Significant news last week regarding for traders of the E-Mini S&P 500 (ES), YM (Mini-sized Dow), NQ (E-Mini NASDAQ-100) and EMD (E-Mini S&P MidCap 400) –as of Sunday, November 18, 2012 the close of the CME Globex for electronically traded equity index futures contracts will change from 4:15 p.m. US/Eastern to 5:15 p.m. US/Eastern. Your broker will most likely cancel any orders you have that are not filled by 5:15 p.m. US/Eastern. This time change will affect your day trading starting Monday, November 19.

* There will be a 15-minute halt in electronic trading from 4:15 p.m. to 4:30 p.m. US/Eastern

* Trading for equity index contracts listed on CME Globex will resume at 4:30 p.m. US/Eastern for the same trade date for 45 minutes, closing at 5:15 p.m. US/Eastern. This includes Fridays, meaning that the end of the trading week on CME Globex also will be changed to 5:15 p.m. US/Eastern

* CME Globex trades that take place during the 4:30 p.m. – 5:15 p.m. US/Eastern time frame will be subject to the daily settlement prices calculated at 4:15 p.m. US/Eastern (i.e., settlement times will not change).

* Trading of equity index contracts on CME Globex will be closed from 5:15 p.m. – 6:00 p.m. US/Eastern.

* Trading re-opens at 6:00 p.m. US/Eastern on CME Globex (Sundays-Thursdays) for the new trade date.

These changes to CME Globex hours coincide with the implementation of daily price limits on equity index contracts (switching from quarterly price limits, pending regulatory review). Daily price limits will be applied each day starting at 6:00 p.m. US/Eastern. The changes are designed to harmonize CME products with the underlying markets at U.S. stock exchanges, which will adopt daily price limits on February 4, 2013, in accordance with updated market-wide circuit breaker rules.

Trading re-opens at 6:00 p.m. US/Eastern on CME Globex (Sundays-Thursdays) for the new trade date.

* The Reference price for daily price limits for the next trade date will be calculated based on the 4:00 p.m. US/Eastern futures prices.

* The width of the equity index futures price limit band will be based on the underlying cash equity index.

* The daily limits will be published on the CME Group website prior to the CME Globex open at 6:00 p.m. US/Eastern.

* CME Globex trading hour changes are effective for both U.S. and international equity index futures and options.

Here is the official announcement from the CME
And a helpful table from the CME
 

Trading Levels and Reports for November 21, 2012

Jump to a section in this post:

1. Market Commentary
2. Support and Resistance Levels – S&P, Nasdaq, Dow Jones, Russell 2000, Dollar Index
3. Support and Resistance Levels – Gold, Euro, Crude Oil, T-Bonds
4. Support and Resistance Levels – Corn, Wheat, Beans, Silver
5. Economic Reports for Wednesday November 21, 2012


Hello Traders,

 If you are an “emini trader” please read the below notice.  The short version of the message below is as follows:


Until now, 3:15 PM  Central time was the cut off and was considered the end of the day for margin purposes. As of this Sunday, 4:15 PM Central time is considered the end of the day for all purposes including day-trading margins. Please read below and let me know if you have any questions.

Effective this Sunday, November 18 for trade date Monday, November 19, electronic trading hours on CME Globex for equity index futures and options, including the e-mini S&P 500, e-mini Dow ($5), e-mini NASDAQ 100, and other contracts, will be changed to the following:


All Times Listed in Central Time (CT)

* Monday-Friday: 5:00 p.m. the previous day – 4:15 p.m.
* There will be a 15-minute trading halt from 3:15 p.m. – 3:30 p.m.

Please note: For all applicable contracts affected by the new trading session times, any trades done before the 4:15 p.m. end of trading session will be considered same business day trades. Any contract that is held in customer accounts at the 4:15 p.m close will require full exchange margin. Any trades done after the market reopen at 5:00 p.m. will be considered next day’s business. Also, all of these products will now end at 4:15 p.m. on Fridays, as opposed to the previous close time of 3:15 p.m.


Trading Levels and Reports for November 20, 2012

Jump to a section in this post:

1. Market Commentary
2. Support and Resistance Levels – S&P, Nasdaq, Dow Jones, Russell 2000, Dollar Index
3. Support and Resistance Levels – Gold, Euro, Crude Oil, T-Bonds
4. Support and Resistance Levels – Corn, Wheat, Beans, Silver
5. Economic Reports for Tuesday November 20, 2012


Hello Traders,

Divergence; A trading tool you can begin using immediately in your own trading

Join us for a Webinar on November 20

Space is limited.
Reserve your Webinar seat now at:
https://www2.gotomeeting.com/register/616488538


The terms ‘divergence’ and ‘convergence’ have been around in the trading sphere for years, but do you know how to properly read these indicators and more importantly, can they help you make better trading decisions?
Join Greg Weitzman founder and president of TheTradingZone as he dissects and reveals how to effectively use divergence in your own trading. For every indicator there is a right way and a wrong way to use them, and ways to  help improve their reliability.
This is a one hour free educational webinar, you will leave with tools and setups you can start using immediately in your own trading.
Register early as Greg is known to draw a crowd and space is limited
As a bonus, all attendees will also get

1. a 30 day demo account from Cannon Trading with our live, advanced charting package that Greg will be using during the webinar
2. a 7 day pass to the Live Trading Room


SEATS ARE LIMITED, SO DON’T MISS THIS SPECIAL FREE WEBINAR!

Risk: Trading Futures, Options on Futures, and retail off-exchange foreign currency transactions involves substantial risk of loss and is not suitable for all investors. You should carefully consider whether trading is suitable for you in light of your circumstances, knowledge, and financial resources. You may lose all or more of your initial investment. Opinions, market data, and recommendations are subject to change at any time.

Title: Divergence, A trading tool you can begin using immediately in your own trading
Date: Tuesday, November 20, 2012
Time: 1:30 PM – 2:30 PM PST

After registering you will receive a confirmation email containing information about joining the Webinar.

System Requirements
PC-based attendees
Required: Windows® 7, Vista, XP or 2003 Server

Mac®-based attendees
Required: Mac OS® X 10.5 or newer

Mobile attendees
Required: iPhone®, iPad®, Android™ phone or Android tablet

Trading Levels and Reports for November 16, 2012

Jump to a section in this post:

1. Market Commentary
2. Support and Resistance Levels – S&P, Nasdaq, Dow Jones, Russell 2000, Dollar Index
3. Support and Resistance Levels – Gold, Euro, Crude Oil, T-Bonds
4. Support and Resistance Levels – Corn, Wheat, Beans, Silver
5. Economic Reports for Friday November 16, 2012


Hello Traders,

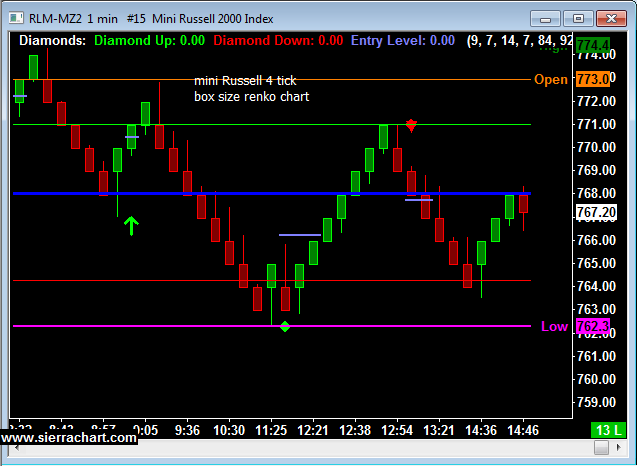
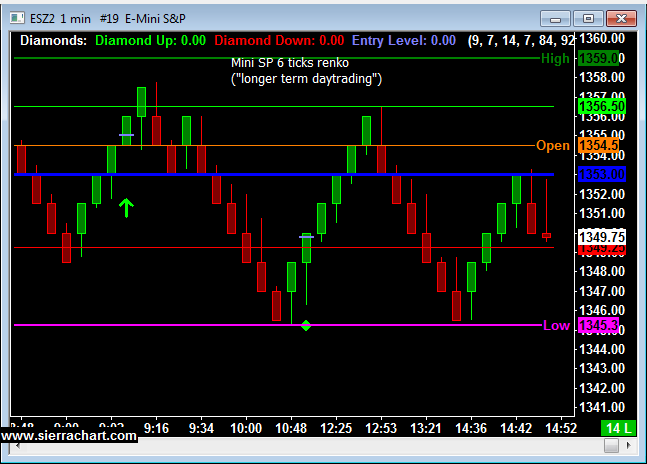
I have been “playing around” , testing renko charts for day trading set ups and find them intriguing enough to spend some more time studying renko charts along with some indicators I like for different day-trading set ups.

Below you will see two screen shots from today’s session. Both use Renko charts

Renko-Chart-1-minute-miniS&P


Renko-Chart-1-minute-miniRussell2000P


Would you like to have access to my DIAMOND and TOPAZ ALGOs as shown above and be able to apply for any market and any time frame on your own PC ?   You can now have a two weeks free trial where I enable the ALGO along with few studies for your own sierra/ ATcharts.

To start your trial, please visit: https://www.cannontrading.com/tools/intraday-futures-trading-signals

If so, please send me an email with the following information:

1. Are you currently trading futures?

2. Charting software you use?

3. If you use sierra or ATcharts, please let me know the user name so I can enable you

4. Markets you currently trading?


Reports and Trading Levels for November 15, 2012

Jump to a section in this post:

1. Market Commentary
2. Support and Resistance Levels – S&P, Nasdaq, Dow Jones, Russell 2000, Dollar Index
3. Support and Resistance Levels – Gold, Euro, Crude Oil, T-Bonds
4. Support and Resistance Levels – Corn, Wheat, Beans, Silver
5. Economic Reports for Thursday November 15, 2012


Hello Traders,

I mentioned last week ( Nov. 7th blog) that the next target on the ES is 1358. Today we met this target and then broke and CLOSED below it.


What next? I wish I had a crystal ball to predict but I don’t….however based on technical tools and statistics my speculation is that we will head towards the 1332 level. That being said, I do think that we are oversold at this point and can see a strong short covering bounce at any time. Daily chart for your review below:

es daily


Trading Levels and Reports for November 14, 2012

Jump to a section in this post:

1. Market Commentary
2. Support and Resistance Levels – S&P, Nasdaq, Dow Jones, Russell 2000, Dollar Index
3. Support and Resistance Levels – Gold, Euro, Crude Oil, T-Bonds
4. Support and Resistance Levels – Corn, Wheat, Beans, Silver
5. Economic Reports for Wednesday November 14, 2012


Hello Traders,

Now – Nov. 19, you can join a free analysis-packed event for investors in the U.S. markets, hosted by Elliott Wave International, the world’s largest financial forecasting firm.

Packed with videos, charts, analysis and more, this event centers around EWI’s three flagship publications: The Elliott Wave TheoristThe Elliott Wave Financial Forecast, and the Short Term Update. During this rare event, you will get to see the analysis and forecasting from each of these premier U.S. market publications.

Here’s an overview of what you’ll get when you sign up now:

  • Robert Prechter’s November video edition of The Elliott Wave Theorist: In the 30 years of publishingTheorist, this is only the third time that Bob has recorded a video issue. You will get select clips of his landmark presentation. You don’t want to miss this!
  • Complete Short Term Updates on Monday, Wednesday and Friday: Chief Market Analyst Steve Hochberg gives you forecasts for the markets’ near-term turns through use of extensive Elliott wave charts.
  • October 2012 Elliott Wave Financial Forecast: 10 pages of analysis of U.S. stocks, bonds, gold, silver and the U.S. Dollar.
  • Steve Hochberg’s “Buy and Hold or Sell and Fold” video presentation, plus his Nov. 8 video interview on CNBC’s Fast Money program.
  • Prechter’s best-seller Conquer the Crash: You can read eight chapters now, including: “When Do Depressions Occur?”, “The Significance of Historically Optimistic Psychology”, and “When Do Stock Markets Turn from Up to Down?”

We could tell you more about this exciting event from EWI, but why not learn more for yourself?

Join EWI’s free event for U.S. investors now >>

There’s no obligation beyond creating your free online profile for instant access to the resources you see above and much, much more.


P.S. This free event will end promptly at noon Eastern time Monday, Nov. 19. Join now for instant access to the free charts, video, analysis, forecasts and more. Learn more.

About the Publisher, Elliott Wave International
Founded in 1979 by Robert R. Prechter Jr., Elliott Wave International (EWI) is the world’s largest market forecasting firm. Its staff of full-time analysts provides 24-hour-a-day market analysis to institutional and private investors around the world.


Trading Levels and Reports for 11-09-2012

Jump to a section in this post:

1. Market Commentary
2. Support and Resistance Levels – S&P, Nasdaq, Dow Jones, Russell 2000, Dollar Index
3. Support and Resistance Levels – Gold, Euro, Crude Oil, T-Bonds
4. Support and Resistance Levels – Corn, Wheat, Beans, Silver
5. Economic Reports for Friday November 9, 2012


Hello Traders,

Market definitely broke to the downside following the election results.

We closed today below the 1384 support level, which opens the door for a test of 1358.

Keep in mind that the day-trading ranges are getting wider, volatility is picking up. For me personally that means two things:

Trade SMALLER quantity and give your trades more room, be more patient on your entries.

Daily chart of the mini SP for your review below:

es daily chart nov. 8th


Trading Levels and Reports for November 7, 2012

Jump to a section in this post:

1. Market Commentary
2. Support and Resistance Levels – S&P, Nasdaq, Dow Jones, Russell 2000, Dollar Index
3. Support and Resistance Levels – Gold, Euro, Crude Oil, T-Bonds
4. Support and Resistance Levels – Corn, Wheat, Beans, Silver
5. Economic Reports for Thursday November 1, 2012


Hello Traders,

Fibonacci Price Waves: Precision Method For Pinpointing High Probability Trades
Join us for a Webinar on November 8
Space is limited.
Reserve your Webinar seat now at:
https://www2.gotomeeting.com/register/210613442
Fibonacci Price Waves: Precision Method For  Pinpointing High Probability TradesJoin us as we host Alla from AlphaWaveTrader.com  for a special presentation on the power of Fibonacci and Fibonacci price waves.
The Futures training webinar will take place on Thursday, November 8th  at 3:15 p.m. CST
In this webinar Alla will demonstrate how:
* Every Support and Resistance level in the market is based upon a Fibonacci Level!
* The market moves are based on Fibonacci Price Waves!
* Fibonacci is the only Predictive Tool that accurately identifies Price Moves!
If you are skeptical: bring the instrument of your choice: Futures, Forex or Stocks, Tick, Daily and Range Charts! It doesn’t matter! Wherever there is Price: There Is The Alpha Wave Trader™ Method!She’ll teach you…how she confidently trades Crude Oil (CL) Futures, Nasdaq E-Mini Futures (NQ) and the Russell 2000 E-mini Futures (TF)…with no indicators.In this Special Webinar, let Alla show you:
* The Precision of Fibonacci Price Waves and Fibonacci based Support And Resistance Levels – which are imperative to Trading Success.
* The Importance of knowing Trend Exhaustion Levels for maximizing your profits.
* How to identify Key Trading Areas for high probability entries and when to stay out of the market.
* How to differentiate between the Minor and Major Trends by simply reading Price.
…. and much more!

*** Attendees will receive a link to attend the AlphaWaveTrader trading room FREE for 4 days following the webinar!SEATS ARE LIMITED, SO DON’T MISS THIS SPECIAL FREE WEBINAR!Risk: Trading Futures, Options on Futures, and retail off-exchange foreign currency transactions involves substantial risk of loss and is not suitable for all investors. You should carefully consider whether trading is suitable for you in light of your circumstances, knowledge, and financial resources. You may lose all or more of your initial investment. Opinions, market data, and recommendations are subject to change at any time.

Title: Fibonacci Price Waves: Precision Method For Pinpointing High Probability Trades
Date: Thursday, November 8, 2012
Time: 1:15 PM – 2:00 PM PST
After registering you will receive a confirmation email containing information about joining the Webinar.