Wednesday Morning Support and Resistance

Here’s a morning cup o’ joe for all you futures traders, our morning support and resistance levels. Good trading!

divider black 190

Support and Resistance Levels – S&P 500, Nasdaq 100, Dow Jones, Mini Russell 2000, 30-Year US Bond, 10-Year US Note

Contract (Dec. 2011) Mini S&P 500 Mini Nasdaq 100 Dow Jones Mini Russell 2000 30-Year US Bond 10-Year US Note
Resistance Level 3——————————————

Resistance Level 2

——————————————

Resistance Level 1

——————————————

Support Level 1

——————————————

Support Level 2

——————————————

Support Level 3

1309.75

1392.00


1289


1279.75


1272


1267.75

2409

2399


2375


2349


2334.5


2312

12749

12600


12463


12341


12312


12262

768.4

767


763.8


751.5


743.9


731.6

14426

14331


14324


14231


14219


14201

13107.5

13104


13101.5


13022


13013


13014.5

Continue reading “Wednesday Morning Support and Resistance”

Tuesday Morning Support and Resistance Numbers

Here’s a morning cup o’ joe for all you futures traders, our morning support and resistance levels. Good trading!

divider black 190

Support and Resistance Levels – S&P 500, Nasdaq 100, Dow Jones, Mini Russell 2000, 30-Year US Bond, 10-Year US Note

Contract (Dec. 2011) Mini S&P 500 Mini Nasdaq 100 Dow Jones Mini Russell 2000 30-Year US Bond 10-Year US Note
Resistance Level 3——————————————

Resistance Level 2

——————————————

Resistance Level 1

——————————————

Support Level 1

——————————————

Support Level 2

——————————————

Support Level 3

1309.75 

1301.50


1289


1282.5


1278.5


1271.25

2409 

2399


2375


2354.25


2345


2328

12749 

12600


12463


12402


12369


12312

768.4 

767


761.5


754


750


743

14324 

14303


14222


14208


14110


14025

13104 

13028


13023


13019


13013


13003

Continue reading “Tuesday Morning Support and Resistance Numbers”

Monday Morning Support and Resistance Numbers

Here’s a morning cup o’ joe for all you futures traders, our morning support and resistance levels. Good trading!

divider black 190

Support and Resistance Levels – S&P 500, Nasdaq 100, Dow Jones, Mini Russell 2000, 30-Year US Bond, 10-Year US Note

Contract (Dec. 2011) Mini S&P 500 Mini Nasdaq 100 Dow Jones Mini Russell 2000 30-Year US Bond 10-Year US Note
Resistance Level 3——————————————

Resistance Level 2

——————————————

Resistance Level 1

——————————————

Support Level 1

——————————————

Support Level 2

——————————————

Support Level 3

1289

1282.25


1279


1260.5


1249


1239

2409

2375


2364


2348


2340


2325

12600

12498


12415


12226


12127


12038

768.4

759


752.6


747.6


745


740.30

14324

14309


14229


14217


14202


14025

13114 (all time high)13107.5


13029


13019


13013


13003

Continue reading “Monday Morning Support and Resistance Numbers”

Weekly Futures Trading Newsletter | Support and Resistance Levels

Jump to a section in this post:
1. Market Commentary
2. Support and Resistance Levels – S&P, Nasdaq, Dow Jones, Russell 2000
3. Support and Resistance Levels – Gold, Euro, Crude Oil, T-Bonds
4. Support and Resistance Levels – March Corn, March Wheat, Jan Beans, March Silver
5. Economic Reports for Friday, January 9, 2012

divider black 190

1. Market Commentary

Wishing all of you a great weekend.

Excellent reading material on our weekly newsletter:
https://www.cannontrading.com/news/trading-beliefs-hot-market-e-mini-dow-futures

2. Support and Resistance Levels – S&P, Nasdaq, Dow Jones, Russell 2000

Contract (Dec. 2011) SP500
(big & Mini)
Nasdaq100
(big & Mini)
Dow Jones
(big & Mini)
Mini Russell
Resistance Level 3 1287.40 2384.00 12448 765.13
Resistance Level 2 1282.30 2372.00 12406 759.07
Resistance Level 1 1278.40 2362.00 12358 753.43
Pivot Point 1273.30 2350.00 12316 747.37
Support Level 1 1269.40 2340.00 12268 741.73
Support Level 2 1264.30 2328.00 12226 735.67
Support Level 3 1260.40 2318.00 12178 730.03

Continue reading “Weekly Futures Trading Newsletter | Support and Resistance Levels”

FRIDAY(!) Morning Support and Resistance Numbers

Here’s a morning cup o’ joe for all you futures traders, our morning support and resistance levels. Good trading!

divider black 190

Support and Resistance Levels – S&P 500, Nasdaq 100, Dow Jones, Mini Russell 2000, 30-Year US Bond, 10-Year US Note

Contract (Dec. 2011) Mini S&P 500 Mini Nasdaq 100 Dow Jones Mini Russell 2000 30-Year US Bond 10-Year US Note
Resistance Level 3 ——————————————Resistance Level 2——————————————

Resistance Level 1

——————————————

Support Level 1

——————————————

Support Level 2

——————————————

Support Level 3

12891282.25


1279


1260.5


1249


1239

24092375


2354


2316


2296


2278

1260012498


12415


12226


12127


12038

768.4759


752.6


747.6


745


740.30

1432414309


14226


14113


14110


14025

1302813025.5


13021


13011


13006.5


12925.5

Continue reading “FRIDAY(!) Morning Support and Resistance Numbers”

Mini Russell daily chart | Support and Resistance Levels

Jump to a section in this post:
1. Market Commentary
2. Support and Resistance Levels – S&P, Nasdaq, Dow Jones, Russell 2000
3. Support and Resistance Levels – Gold, Euro, Crude Oil, T-Bonds
4. Support and Resistance Levels – March Corn, March Wheat, Jan Beans, March Silver
5. Economic Reports for Friday, January 6, 2012

divider black 190

1. Market Commentary

Volume slowly trickling back, I expect that by Monday volume will return to “normal”.

Unemployment report tomorrow should move the markets.

Understanding the type of trading environment you are in is crucial.

Past two weeks markets were in “Holiday Mode” = lighter volume, narrower ranges etc.

Before that we had periods of higher volatility, wider ranges, higher volume.

Different types of market environments require adjusting your approach.

Here is a small write up I share with my webinar subscribers:

My opinion is that there are 3 main types of trading days.

1. Most common is two sided trading action with swings up and down – this type of trading day is most suitable for the main aspect of this model, which is taking trades based on the arrows.
2. Strong trending day, mostly one directional – this type of trading day is the least common, many times will happen on Mondays and maybe 3-5 times a month at most – this type of trading day is most suitable for using the color scheme I have on the charts. Green bars mean strong up trend, red bars mean strong down trend. If you determined that this is a trend day, then use pull backs to enter with the direction of trend and use the parabolic (little dashes) as you trailing stop.
3. Slow and/ or choppy trading day – this type of trading day is best suited for taking small profits from the market by either using the main model or taking the diamonds as entry signal, going for quick profits and tight stops.

Good question is how can one asses what type of trading day we will have while the market is still trading….I am doing some work about it and will be happy to hear feedback via email but here are some initial observations:
Was the overnight session a wide, two sided trading range? If the answer is yes, good chances for similar trading day during the primary session ( primary session is when the cash/ stock market is open)
Mondays have the highest chance for trending days
The behavior of the first hour of trading can also suggests the type of action for the rest of the day.
If the first 30 minutes have good volume, better chances for type 1 or type 2 trading days.
low volume during first 30 minutes can suggest a choppy (type 3 trading day)

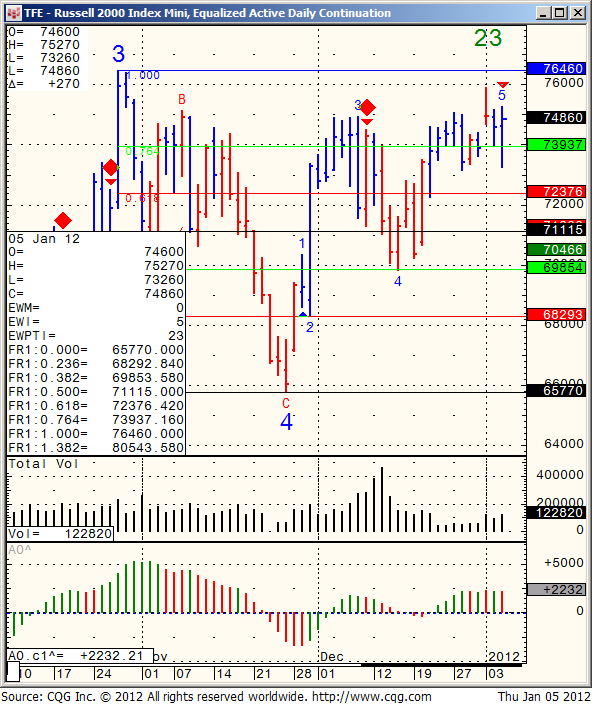
Mini Russell daily chart for your review below:
515

Continue reading “Mini Russell daily chart | Support and Resistance Levels”

Thursday Morning Support and Resistance Numbers

Here’s a morning cup o’ joe for all you futures traders, our morning support and resistance levels. Good trading!

divider black 190

Support and Resistance Levels – S&P 500, Nasdaq 100, Dow Jones, Mini Russell 2000, 30-Year US Bond, 10-Year US Note

Contract (Dec. 2011) Mini S&P 500 Mini Nasdaq 100 Dow Jones Mini Russell 2000 30-Year US Bond 10-Year US Note
Resistance Level 3 ——————————————Resistance Level 2——————————————

Resistance Level 1

——————————————

Support Level 1

——————————————

Support Level 2

——————————————

Support Level 3

1279 

1272.75


1270.5


1261.5


1257


1247.75

2375 

2345


2330.75


2299


2282.5


2267.5

12415 

12356


12320


12226


12127


12038

759 

749.9


744.2


745.3


742


731.60

14331 

14306


14224


14129


14113


14025

13027 

13023


13019


13011


13006.5


12925.5

Continue reading “Thursday Morning Support and Resistance Numbers”

Friday Morning New Years Eve Eve Support and Resistance Numbers

Here’s a morning cup o’ joe for all you futures traders, our morning support and resistance levels. Good trading!

divider black 190

Support and Resistance Levels – S&P 500, Nasdaq 100, Dow Jones, Mini Russell 2000, 30-Year US Bond, 10-Year US Note

Contract (Dec. 2011) Mini S&P 500 Mini Nasdaq 100 Dow Jones Mini Russell 2000 30-Year US Bond 10-Year US Note
Resistance Level 3——————————————

Resistance Level 2

——————————————

Resistance Level 1

——————————————

Support Level 1

——————————————

Support Level 2

——————————————

Support Level 3

1275 

1268


1264.5


1243.25


1238.25


1230

2323 

2307


2296


2250


2239


2204

12333 

12280


12260


12068


12031


11961

768.4 

752.9


750.8


733.4


730.60


718.20

14611 

14500


14420


14400


14320


14310

13130 (all time High)13114


13100


13022.5


13017.5


13008.5

Continue reading “Friday Morning New Years Eve Eve Support and Resistance Numbers”

Last Trading Day of The Year | Support and Resistance Levels

Jump to a section in this post:
1. Market Commentary
2. Support and Resistance Levels – S&P, Nasdaq, Dow Jones, Russell 2000
3. Support and Resistance Levels – Gold, Euro, Crude Oil, T-Bonds
4. Support and Resistance Levels – March Corn, March Wheat, Jan Beans, March Silver
5. Economic Reports for Thursday, December 29 2011

divider black 190

1. Market Commentary

Last trading day for 2011 is tomorrow, I expect another thin volume day but sometimes, last trading day of the month/ year on thin volume can create some volatility.

Holiday Hours available at:

New Year’s 2012 Futures Trading Hours and Holiday Trading Schedule

2. Support and Resistance Levels – S&P, Nasdaq, Dow Jones, Russell 2000

Contract (Dec. 2011) SP500
(big & Mini)
Nasdaq100
(big & Mini)
Dow Jones
(big & Mini)
Mini Russell
Resistance Level 3 1270.43 2309.00 12349 755.83
Resistance Level 2 1263.97 2294.50 12279 749.47
Resistance Level 1 1260.73 2287.00 12244 746.13
Pivot Point 1254.27 2272.50 12174 739.77
Support Level 1 1251.03 2265.00 12139 736.43
Support Level 2 1244.57 2250.50 12069 730.07
Support Level 3 1241.33 2243.00 12034 726.73

Continue reading “Last Trading Day of The Year | Support and Resistance Levels”