Mini S&P Charts & Economic Reports 6.06.2014

Connect with Us! Use Our Futures Trading Levels and Economic Reports RSS Feed.

Like us on FacebookFollow us on TwitterView our profile on LinkedInFind us on Google+Cannon Trading Futures Trading Resistance & Support Levels and Economic ReportsFind us on Yelp

1. Market Commentary
2. Futures Support and Resistance Levels – S&P, Nasdaq, Dow Jones, Russell 2000, Dollar Index
3. Commodities Support and Resistance Levels – Gold, Euro, Crude Oil, T-Bonds
4. Commodities Support and Resistance Levels – Corn, Wheat, Beans, Silver
5. Futures Economic Reports for Friday June 6, 2014

Hello Traders,

For 2014 I would like to wish all of you discipline and patience in your trading!


I was talking about how volatility comes and goes in cycles yesterday and sure enough after ECB decision to lower rates, we saw some good, two sided trading action in stock indices along with much better volume.

More to come tomorrow in my opinion as market awaits monthly unemployment report before the cash opens ( 5:30 AM pacific time/ 7:30 AM Central time)

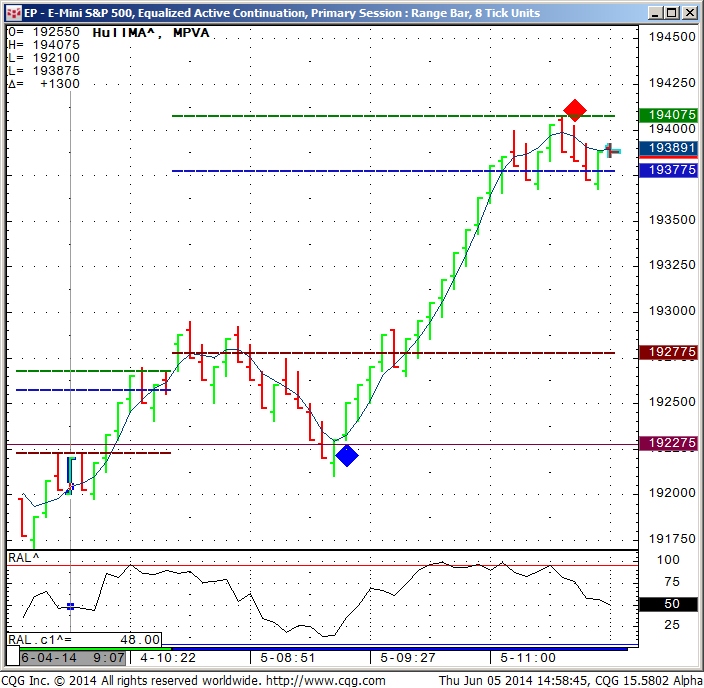
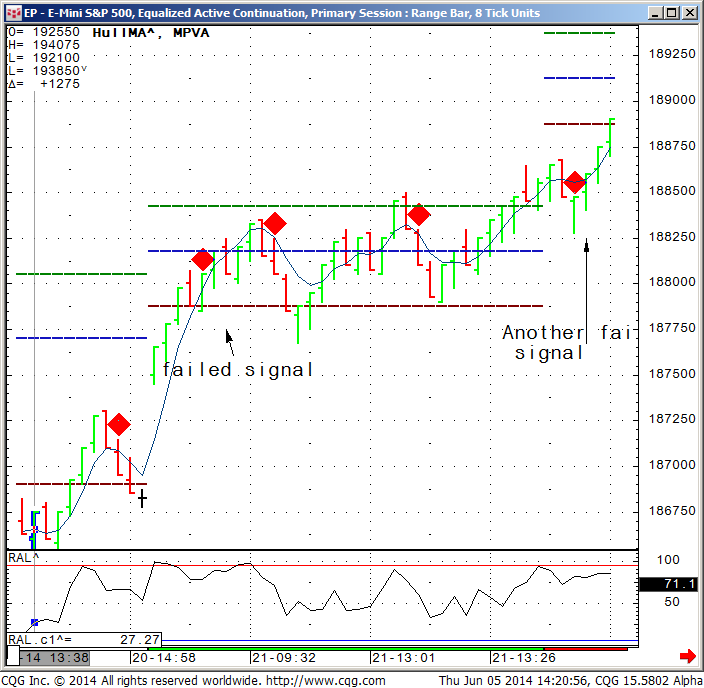
I must share with you my mini SP chart set up as it played out today which shows the only two signals for today  -1 buy and 1 sell ( blue diamond buy, red diamond sell). To keep this balanced I am also sharing a screen shot from a few trading days ago where two of the red diamonds generated a “failed” sell signal.

If you like a trial for the ALGO, please read below the charts:

Today’s session:

817


May 21st 2014 session:

816


Would you like to have access to my DIAMOND and TOPAZ ALGOs as shown above

and be able to apply for any market and any time frame on your own PC ?   You can now have a three weeks free trial where I enable the ALGO along with few studies for your own sierra/ ATcharts and/or CQG .


To start your trial, please visit:


If so, please send me an email with the following information:


1. Are you currently trading futures?

2. Charting software you use?

3. If you use sierra or ATcharts, please let me know the user name so I can enable you

4. Markets you currently trading?


HYPOTHETICAL PERFORMANCE RESULTS HAVE MANY INHERENT LIMITATIONS, SOME OF WHICH ARE DESCRIBED BELOW.  NO REPRESENTATION IS BEING MADE THAT ANY ACCOUNT WILL OR IS LIKELY TO ACHIEVE PROFITS OR LOSSES SIMILAR TO THOSE SHOWN.  IN FACT, THERE ARE FREQUENTLY SHARP DIFFERENCES BETWEEN HYPOTHETICAL PERFORMANCE RESULTS AND THE ACTUAL RESULTS SUBSEQUENTLY ACHIEVED BY ANY PARTICULAR TRADING PROGRAM.


ONE OF THE LIMITATIONS OF HYPOTHETICAL PERFORMANCE RESULTS IS THAT THEY ARE GENERALLY PREPARED WITH THE BENEFIT OF HINDSIGHT.  IN ADDITION, HYPOTHETICAL TRADING DOES NO INVOLVE FINANCIAL RISK, AND NO HYPOTHETICAL TRADING RECORD CAN COMPLETELY ACCOUNT FOR THE IMPACT OF FINANCIAL RISK IN ACTUAL TRADING.  FOR EXAMPLE, THE ABILITY TO WITHSTAND LOSSES OR TO ADHERE TO A PARTICULAR TRADING PROGRAM IN SPITE OF TRADING LOSSES ARE MATERIAL POINTS WHICH CAN ALSO ADVERSELY AFFECT ACTUAL TRADING RESULTS.  THERE ARE NUMEROUS OTHER FACTORS RELATED TO THE MARKETS IN GENERAL OR TO THE IMPLEMENTATION OF ANY SPECIFIC TRADING PROGRAM WHICH CANNOT BE FULLY ACCOUNTED FOR IN THE PREPARATION OF HYPOTHETICAL PERFORMANCE RESULTS AND ALL OF WHICH CAN ADVERSELY AFFECT ACTUAL TRADING RESULTS


If you like the information we share? We would appreciate your positive reviews on our new yelp!! Continue reading “Mini S&P Charts & Economic Reports 6.06.2014”

Futures Markets Update & Economic Reports 6.03.2014

Connect with Us! Use Our Futures Trading Levels and Economic Reports RSS Feed.

Like us on FacebookFollow us on TwitterView our profile on LinkedInFind us on Google+Cannon Trading Futures Trading Resistance & Support Levels and Economic ReportsFind us on Yelp

1. Market Commentary
2. Futures Support and Resistance Levels – S&P, Nasdaq, Dow Jones, Russell 2000, Dollar Index
3. Commodities Support and Resistance Levels – Gold, Euro, Crude Oil, T-Bonds
4. Commodities Support and Resistance Levels – Corn, Wheat, Beans, Silver
5. Futures Economic Reports for Tuesday June 3, 2014

Hello Traders,

For 2014 I would like to wish all of you discipline and patience in your trading!

   TradeTheNews.com Weekly Market Update: Buy in May…

Fri, 30 May 2014 16:13 PM EST- Both equities and bonds gained ground slowly this week: the S&P500 pushed out to record highs above 1,920 and the benchmark US 10-year yield fell as low as 2.433%, its lowest level since last June. In Europe, the DAX was at all-time highs and the FTSE was only 100 points away from all-time highs. Meanwhile, trading volumes were pretty light, due in part to the Memorial Day holiday in the United States and Ascension Day in Europe. But with ever strengthening asset prices comes complacency: the VIX volatility index dropped to 11.46 (last Friday’s bottom was 11.36, the lowest reading since March 2013) and a break below 11.00 would put the index right where it was at the beginning of 2007, which makes many analysts very uncomfortable. For the week, the DJIA rose 0.7%, the S&P500 added 1.2% and the Nasdaq gained 1.4%.- The second reading of US Q1 GDP was revised to -1.0% from +0.1% in the advance reading. The downward revision was due to a larger drag from inventories and less government spending than surmised by the advance reading. This marks only the second time since the recession that GDP declined during a quarter. There is also concern about Q1 gross domestic income, which fell 2.3%, its worst performance since the recession. Note that the personal consumption figure stayed very strong at +3.1%. Fed presidents Williams and Plosser both said they were not too worried about the weak data and said there would be a big snapback in the Q2 GDP figures. In yet another sign inflation is rebounding, the April PCE index rose to its highest annualized rate since late 2012. The personal consumption expenditure index rose 0.2% in April, as did the core rate that strips out food and energy.

– Billionaire oligarch Petro Poroshenko won the Ukrainian presidential elections on May 25, taking 55% of the vote, with Yulia Tymoshenko trailing with 13%. The decisive victory prevented a runoff and leaves Poroshenko in a strong position to continue Kiev’s “anti-terrorist” operations in the eastern part of the country. There was more violence in the east this week, as militants shot down helicopters and launched assaults on military bases, leading to scores of casualties. Note that Poroshenko will be sworn in as Ukraine’s fifth president on June 7, and he has promised to immediately dissolve parliament and call early elections. Ukraine began payments for gas debt owed to Gazprom, and it looks as though negotiations will continue and prevent Russia from demanding pre-payment for future gas deliveries.

– Gold prices took a 2% tumble on Tuesday after China’s gold imports from Hong Kong fell in April amid signs that investment demand is waning. Moreover, the decisive election outcome in Ukraine and Russia’s conciliatory moves helped drive the safe haven lower. Prices fell further in the second half of the week, and spot gold closed out the week around $1,250, at February lows.

– Pfizer let the clock run out on its bid for AstraZeneca, with no higher offer or further interest from AstraZeneca. Under UK takeover rules, Pfizer could resubmit another offer for AstraZeneca in six months, meaning the chances of a deal are not entirely gone. In contrast, Valeant continued its full court press, and in the span of a few days boosted the cash component of its offer for Allergan twice, first by $10 to $58.30/share and then again by $13.70 to $72/share (the firm maintained the equity component at 0.83 of a Valeant share). Pilgrim’s Pride offered to buy Hillshire Brands for $45/share in cash, in a deal worth $6.4 billion. Recall that back on May 12th, Hillshire cut its own deal to buy Pinnacle Foods for $36/share in cash and stock, in a total deal valued around $4.3 billion.

– Next week, the Obama administration will roll out a set of EPA proposals to regulate emissions from existing power plants, including coal plants. The key structure of the proposals will be a cap-and-trade system designed to give states the flexibility to meet benchmarks, as opposed to placing emissions limits on individual plants. Recall that last week, there were reports suggesting the EPA rules could result in a required 25% cut in greenhouse gas emissions by the utility sector.

– Homebuilder Toll Brothers more than doubled its profits in the first quarter, widely beating both earnings and revenue expectations. The company reaffirmed its FY targets, slightly raising the low end of its average selling price outlook. The backlog and deliveries grew by healthy double-digit percentages, indicating that the housing recovery is on track, at least at the high end of the market. “We are in a leveling period in the early stages of the housing recovery with significant pent-up demand building,” said TOL’s CEO.

– Comments by ECB figures suggest the chances of easing at next Thursday’s ECB Council meeting are looking better and better. President Draghi warned about the potential for a “negative spiral” between low inflation, falling inflation expectations and poor credit availability. Austria’s Nowotny said the ECB cannot allow destabilization of inflation expectations and admitted that a rate cut is under discussion. Luxembourg’s Mersch warned that multiple steps could be taken at next week’s meeting. The consensus view is that the deposit rate will be cut into negative territory for the first time ever, and staff inflation forecasts will be significantly reduced, signaling the ECB’s seriousness about the need for more action to fight deflation. EUR/USD traded in a very tight range, from a high of 1.3670 on Monday to lows around 1.3600 mid-week.

– Three key Japanese economic reports provided a worrying but not wholly unexpected view of the continuing impact of PM Abe’s reforms. April retail sales saw their biggest annual decline in over three years (-13.7% m/m, -4.4% y/y). This is the first report in the series since the VAT tax went up to 8% from 5% on April 1st. Recall the March y/y figure was +11%, boosted by buying ahead of the tax hike. April industrial production was weaker than expected, prompting Tokyo to lower its economic assessment on the sector to “flattening as a trend.” Finally April national CPI (+3.1%) and May Tokyo CPI (+3.4%) rose at their fastest rates in two decades. The CPI data were driven higher by the consumption tax hike being passed on to consumers, and analysts are divided on the extent to which the adjusted version really meets the BoJ’s 2% target. USD/JPY was locked in the top half of the 101 handle.

– Chinese authorities have sworn off massive stimulus programs as a means for bolstering the nation’s slowing economy, and as a result Beijing is looking to more targeted approaches. The housing market is slowing and April industrial profit growth data out this week slowed to single digits y/y. Cutting the reserve requirement ratio is widely understood to be the next weapon in the arsenal. Various commentators said that the chances of a RRR cut in the second half of 2014 is looking increasingly likely, and JPMorgan said there would be at least two RRR reductions. Beijing’s other, less subtle weapon is to weaken the renminbi: this week the PBoC let the yuan mid-point drop to 6.1705, its weakest setting since last September.

– There were renewed tensions between China and Vietnam after a Chinese ship rammed and sunk a Vietnamese fishing vessel. A spokesperson for the Vietnamese Foreign Ministry said that the fishing boat was initially surrounded by 40 Chinese ships approximately 17 nautical miles from the China Haiyang Shiyou-981 oil rig. The oil rig was the cause of violent anti-China protests earlier this month. At the ASEAN conference in Singapore, Japan PM Abe commented that Japan would start to play a more proactive role in maintaining security in Asia and support efforts by the Philippines and Vietnam to resolve conflicts.


If you like the information we share? We would appreciate your positive reviews on our new yelp!! Continue reading “Futures Markets Update & Economic Reports 6.03.2014”

Futures Levels and Economic Reports for 5.30.2014

Connect with Us! Use Our Futures Trading Levels and Economic Reports RSS Feed.

Like us on FacebookFollow us on TwitterView our profile on LinkedInFind us on Google+Cannon Trading Futures Trading Resistance & Support Levels and Economic ReportsFind us on Yelp

1. Market Commentary
2. Futures Support and Resistance Levels – S&P, Nasdaq, Dow Jones, Russell 2000, Dollar Index
3. Commodities Support and Resistance Levels – Gold, Euro, Crude Oil, T-Bonds
4. Commodities Support and Resistance Levels – Corn, Wheat, Beans, Silver
5. Futures Economic Reports for Friday May 30, 2014

Hello Traders,

For 2014 I would like to wish all of you discipline and patience in your trading!


US Bonds front month as of tomorrow is SEPTEMBER~  ZB U4.

FRONT month for gold  is AUGUST GC Q4 or GGC Q4.

Indices and Currencies are still trading the June contract.

Excellent and interesting resource for those of you who step out of the day-trading world, courtesy of www.MRCI.com :


http://www.mrci.com/special/correl.htm

Of course, one would expect gold and silver futures to move in tandem, to correlate closely, with each other. They’re both precious metals, aren’t they? But silver is also a by product of copper mining. Would they tend to trade together-or contrarily?

Similarly, one might expect price activity in Euros and T-bonds to be similar. Conversely, the Swiss Franc and the Dollar Index should have opposite reactions to the same market input.

A primary rationale behind the continuing bull market in stocks has been declining interest rates. How closely, in fact, have T-bond and SP500 futures tracked each other on a daily basis?

For years traders have made a very non-fundamental connection between the silver and soybean markets. How closely have they traded?

Heating oil and crude oil-yes. But live cattle and the J-Yen???

Some brief explanation is required. The singular relationship under consideration is the frequency of duplicated up/down daily closings. E.g., if Market A closed higher on Day 1, did also Market B? (In that respect, the study is qualitative, not quantitative, i.e., the amount is irrelevant.)

Without going into further details of least-squares and scatterplots, the precise statistical terminology that describes each relationship is a sample coefficient of correlation, a number greater than -1 and less than +1. Thus, if, every day over the sample period, each of two markets duplicated the other’s higher or lower closing, they would have a coefficient of correlation equal to 1/1, or +1. Conversely, two markets that always closed contrarily to each other would have a coefficient equal to -1. A 0 value indicates no correlation whatsoever. For convenience, however, all values in the spread sheet have been stated in terms of percentages of +1 or -1.

Remember, the amount of change is irrelevant, which can account for differences in trend.

Continue reading “Futures Levels and Economic Reports for 5.30.2014”

Memorial Day Futures Trading Schedule & Minutes of Fed Reserve Report by Pedro Nicolaci da Costa 5.22.2014

Connect with Us! Use Our Futures Trading Levels and Economic Reports RSS Feed.

Like us on FacebookFollow us on TwitterView our profile on LinkedInFind us on Google+Cannon Trading Futures Trading Resistance & Support Levels and Economic ReportsFind us on Yelp

1. Market Commentary
2. Futures Support and Resistance Levels – S&P, Nasdaq, Dow Jones, Russell 2000, Dollar Index
3. Commodities Support and Resistance Levels – Gold, Euro, Crude Oil, T-Bonds
4. Commodities Support and Resistance Levels – Corn, Wheat, Beans, Silver
5. Futures Economic Reports for Thursday May 22, 2014

Hello Traders,

For 2014 I would like to wish all of you discipline and patience in your trading!


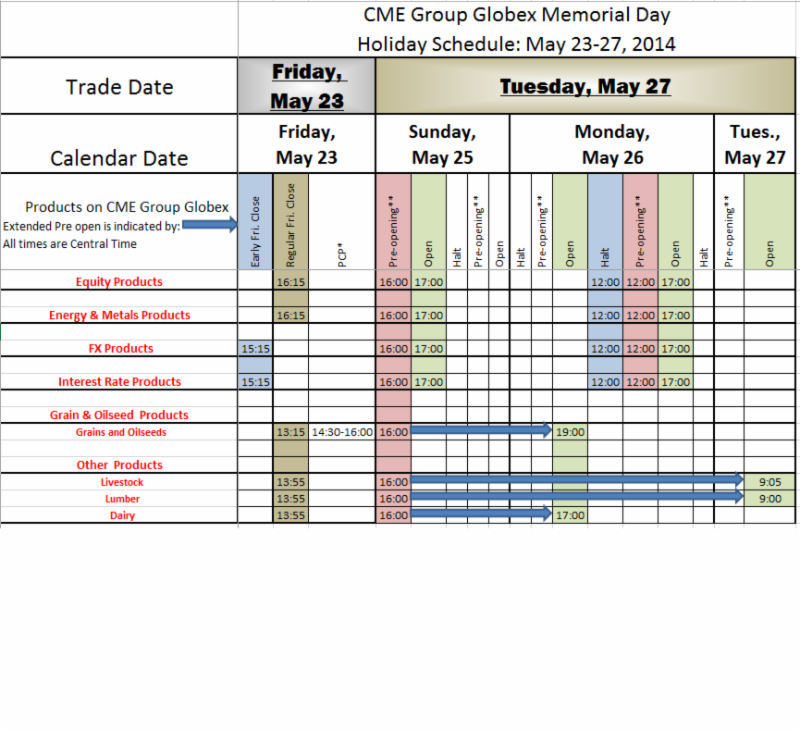
Memorial Day Weekend is right around the corner!!

Holiday schedule is now available.

Key Passages: Read the Federal Reserve Meeting Minutes in Just a Minute — WSJ Blog

05/21/2014 13:01

By Pedro Nicolaci da Costa
Minutes of the Federal Reserve’s April 29-30 meeting showed policy makers are still hoping for stronger economic growth in the second half of the year. The economic assessment of Federal Open Market Committee participants emphasizes the central bank is so far sticking to its forecasts.
Here are some key excerpts, with quotes in italics:
“In their discussion of the economic situation and the outlook, meeting participants generally indicated that their assessment of the economic outlook had not changed materially since the March meeting. Severe winter weather had contributed to a sharp slowing in activity during the first quarter, but recent indicators pointed to a rebound and suggested that the economy had returned to a trajectory of moderate growth.”
However, that passage is quickly peppered with a note of caution:
“Some participants remarked that it was it was too early to confirm that the bounceback in economic activity would put the economy on a path of sustained above-trend economic growth. In general, participants continued to view the risks to the outlook for the economy and the labor market as nearly balanced. However, a number of participants pointed to possible sources of downside risk to growth, including a persistent slowdown in the housing sector or potential international developments, such as a further slowing of growth in China or an increase in geopolitical tensions regarding Russia and Ukraine.”
In addition, officials seem to have spent quite a bit of time discussing a flagging housing sector, which is key to the economic recovery from the Fed’s perspective.
“Most participants commented on the continuing weakness in housing activity. They saw a range of factors affecting the housing market, including higher home prices, construction bottlenecks stemming from a scarcity of labor and harsh winter weather, input cost pressures, or a shortage in the supply of available lots.”
On the policy front, there was agreement about reducing the pace of monthly bond purchases further in incremental, $10 billion steps. The Fed also had an extensive discussion about its plans for exiting its extraordinary low-interest rate policies. The strategy is still evolving as policy makers assess which tools might work best when the time comes to begin tightening monetary policy.
“Participants considered how various combinations of tools could have different implications for the degree of control over short-term interest rates, for the Federal Reserve’s balance sheet and remittances to the Treasury, for the functioning of the federal funds market, and for financial stability in both normal times and in periods of stress. Because the Federal Reserve has not previously tightened the stance of policy while holding a large balance sheet, most participants judged that the Committee should consider a range of options and be prepared to adjust the mix of its policy tools as warranted. Participants generally favored the further testing of various tools, including the [Term Deposit Facility], to better assess their operational readiness and effectiveness.”
And, there’s more where that came from:
“No decisions regarding policy normalization were taken; participants requested additional analysis from the staff and agreed that it would be helpful to continue to review these issues at upcoming meetings.”

More at The Wall Street Journal’s Real Time Economics blog,http://blogs.wsj.com/economics/


If you like the information we share? We would appreciate your positive reviews on our new yelp!! Continue reading “Memorial Day Futures Trading Schedule & Minutes of Fed Reserve Report by Pedro Nicolaci da Costa 5.22.2014”

Futures Market Reports & Trading Levels 5.21.2014

Connect with Us! Use Our Futures Trading Levels and Economic Reports RSS Feed.

Like us on FacebookFollow us on TwitterView our profile on LinkedInFind us on Google+Cannon Trading Futures Trading Resistance & Support Levels and Economic ReportsFind us on Yelp

1. Market Commentary
2. Futures Support and Resistance Levels – S&P, Nasdaq, Dow Jones, Russell 2000, Dollar Index
3. Commodities Support and Resistance Levels – Gold, Euro, Crude Oil, T-Bonds
4. Commodities Support and Resistance Levels – Corn, Wheat, Beans, Silver
5. Futures Economic Reports for Wednesday May 21, 2014

Hello Traders,

For 2014 I would like to wish all of you discipline and patience in your trading!


I mentioned yesterday that we have good chances of higher volume / volatility move after the very low energy day we saw to start the week, and I was right (for a change (-:

SP500 finished down 14 points and traded about 1.5 million contracts, almost 60% more than we did on Monday.

We got a few more reports tomorrow morning followed by FOMC minutes (1 PM central)  which is a market MOVER event so my thought is that we may see some additional volatility tomorrow.


Why am I discussing this topic for two days in a row now?


I think that different types of trading days require different trading approaches/ strategies and if that you can assess quickly if this is a range bound day or more volatile / larger moves days EARLY enough, it may save you from trying to “average up/down” to soon or you may have better chances with break out strategies etc.


Continue reading “Futures Market Reports & Trading Levels 5.21.2014”

Low Volume across all Futures Markets & Economic Reports / Levels 5.20.2014

Connect with Us! Use Our Futures Trading Levels and Economic Reports RSS Feed.

Like us on FacebookFollow us on TwitterView our profile on LinkedInFind us on Google+Cannon Trading Futures Trading Resistance & Support Levels and Economic ReportsFind us on Yelp

1. Market Commentary
2. Futures Support and Resistance Levels – S&P, Nasdaq, Dow Jones, Russell 2000, Dollar Index
3. Commodities Support and Resistance Levels – Gold, Euro, Crude Oil, T-Bonds
4. Commodities Support and Resistance Levels – Corn, Wheat, Beans, Silver
5. Futures Economic Reports for Tuesday May 20, 2014

Hello Traders,

For 2014 I would like to wish all of you discipline and patience in your trading!


We started the week with very low volume, low energy type of trading across the markets.


Not my favorite conditions but that is part of trading….YOU need to adjust to what the market is doing, how the market is trading/ behaving since the opposite will NOT happen….mini SP volume looks to be under 1 million contracts today, which is well below the average volume.  If anything, days like today are sometimes followed by higher volatility/ higher volume days, so make sure to see what type of trading range/ volatility the overnight session had and how the first 30 minutes of trading tomorrow look like to see if it can help you asses the type of trading day ahead of you.


If you like the information we share? We would appreciate your positive reviews on our new yelp!! Continue reading “Low Volume across all Futures Markets & Economic Reports / Levels 5.20.2014”

Futures Relationships between the Mini S&P and Mini Russell 2000 5.15.2014

Connect with Us! Use Our Futures Trading Levels and Economic Reports RSS Feed.

Like us on FacebookFollow us on TwitterView our profile on LinkedInFind us on Google+Cannon Trading Futures Trading Resistance & Support Levels and Economic ReportsFind us on Yelp

1. Market Commentary
2. Futures Support and Resistance Levels – S&P, Nasdaq, Dow Jones, Russell 2000, Dollar Index
3. Commodities Support and Resistance Levels – Gold, Euro, Crude Oil, T-Bonds
4. Commodities Support and Resistance Levels – Corn, Wheat, Beans, Silver
5. Futures Economic Reports for Thursday May 15, 2014

Hello Traders,

For 2014 I would like to wish all of you discipline and patience in your trading!


I wrote a quick paragraph about observing the relationship between the mini Russell 2000 and the mini SP 500 yesterday and I got a response from one of our readers that I thought is worth sharing and has some good observations, so here is below with very minor edits:


Hi Ilan,


I received your comments about Russell leading SP’s in tonight’s email, and as someone who has been watching and studying this relationship for over 5 years, I wanted to make a few comments.


Russell 2000 does tend to lead other Indexes on larger time frames like daily and larger intra-day charts like 30 min and higher. However nothing is a simple as it seems of course. And one of the biggest reasons it is not simple is because large traders and institutions know that small traders are trying to get clues from TF to trade ES, and I have seen many times where they will come in and start buying Russell and a few minutes

later start selling much larger size in ES.
Also, quite often these two Indexes will trade without any correlation at all shorter term, not sure if you saw closing minutes of Monday’s trading where TF dropped 7 points in a few minutes and ES did not budge. And then there is a matter of difference in liquidity of course, sometimes I see quite opposite take place – where ES starts moving and TF is sitting there, and it’s not until ES moved two whole points does TF starts to move a little, this happens because TF buyer will have to give up a lot of edge to buy any kind of size, and they need to see a decent move in ES before they will buy TF.


What I described above is a very small example of what happens between these two Indexes, it is important to understand that what seems to be correlation short term, in access of 80% of the time will not produce desired results. With that said….there are instances when TF’s lead is obvious, but it takes quite a bit of time to learn and understand mechanics behind it, I am afraid comparing two intra-day charts will not shed any light on this relationship, there is too much more going behind “the scenes”


Sincerely,

Simon B.


If you like the information we share? We would appreciate your positive reviews on our new yelp!! Continue reading “Futures Relationships between the Mini S&P and Mini Russell 2000 5.15.2014”

Rally in the Cash Markets and Dow Jones Futures Daily Chart 5.13.2014

Connect with Us! Use Our Futures Trading Levels and Economic Reports RSS Feed.

Like us on FacebookFollow us on TwitterView our profile on LinkedInFind us on Google+Cannon Trading Futures Trading Resistance & Support Levels and Economic ReportsFind us on Yelp

1. Market Commentary
2. Futures Support and Resistance Levels – S&P, Nasdaq, Dow Jones, Russell 2000, Dollar Index
3. Commodities Support and Resistance Levels – Gold, Euro, Crude Oil, T-Bonds
4. Commodities Support and Resistance Levels – Corn, Wheat, Beans, Silver
5. Futures Economic Reports for Tuesday May 13, 2014

Hello Traders,

For 2014 I would like to wish all of you discipline and patience in your trading!


Must say this rally caught me off guard….

I am letting my rational mind do the thinking instead of my trading mind…..

My rational mind is asking “Why the heck are we trading where are, making all time highs?”

My trading mind is saying “Market found support and is resuming the path of least resistance….which is up”

For some reason when it comes to stock index futures I keep making the mistake of allowing my rational mind get in there.

I don’t do it with other markets…If crude is making a big move I use my “trading mind”, same with Natural Gas, gold etc. for some reason with stock index futures I tend to fight  and argue with the market and the market always wins….


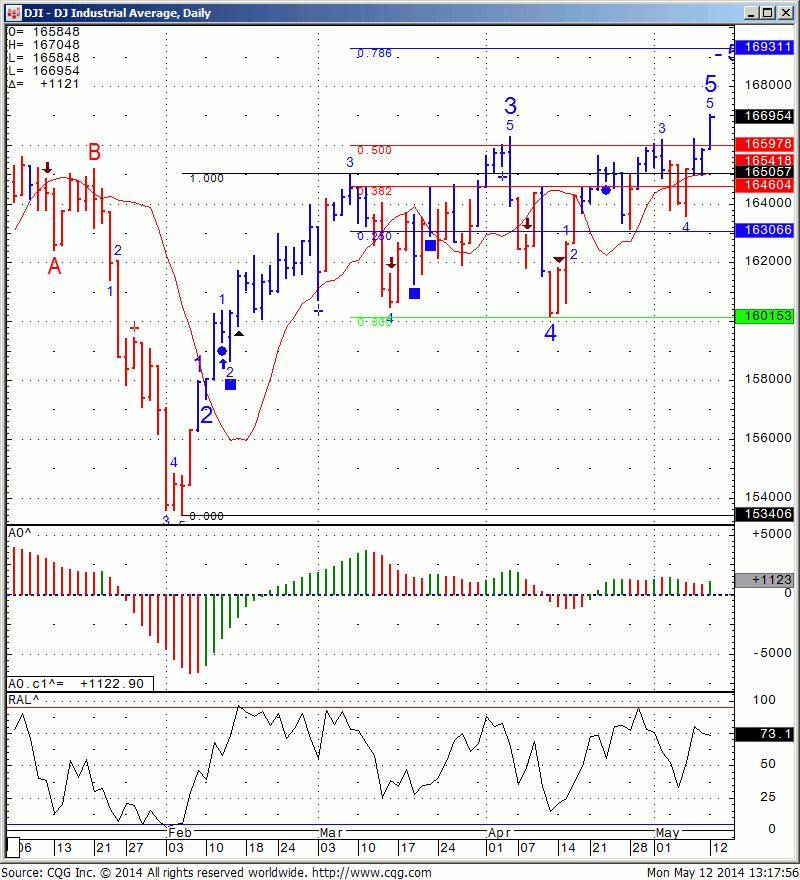
Daily chart of the Dow Jones Cash index below for your review:


812


If you like the information we share? We would appreciate your positive reviews on our new yelp!! Continue reading “Rally in the Cash Markets and Dow Jones Futures Daily Chart 5.13.2014”

Mini Russell & Mini S&P Heikin Ashi Charts & Economic Reports 5.09.2014

Connect with Us! Use Our Futures Trading Levels and Economic Reports RSS Feed.

Like us on FacebookFollow us on TwitterView our profile on LinkedInFind us on Google+Cannon Trading Futures Trading Resistance & Support Levels and Economic ReportsFind us on Yelp

1. Market Commentary
2. Futures Support and Resistance Levels – S&P, Nasdaq, Dow Jones, Russell 2000, Dollar Index
3. Commodities Support and Resistance Levels – Gold, Euro, Crude Oil, T-Bonds
4. Commodities Support and Resistance Levels – Corn, Wheat, Beans, Silver
5. Futures Economic Reports for Friday May 9, 2014

Hello Traders,

For 2014 I would like to wish all of you discipline and patience in your trading!


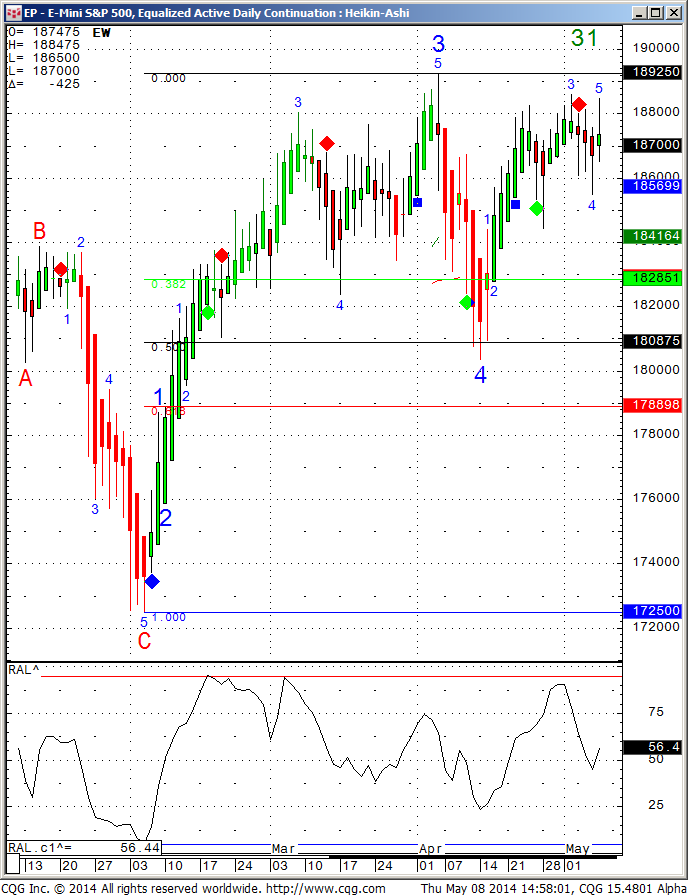
Seems like both the NASDAQ and the Russell had a healthy correction over the past 8 weeks while both the Dow and the SP500 are still flirting with the all time highs. The big question is who going to catch up with who…NASDAQ and Russell starts edging higher or SP and Dow start going lower?


Daily charts of the mini Russell 2000 as well as the mini SP 500 for your review below:

810


 811


If you like the information we share? We would appreciate your positive reviews on our new yelp!! Continue reading “Mini Russell & Mini S&P Heikin Ashi Charts & Economic Reports 5.09.2014”