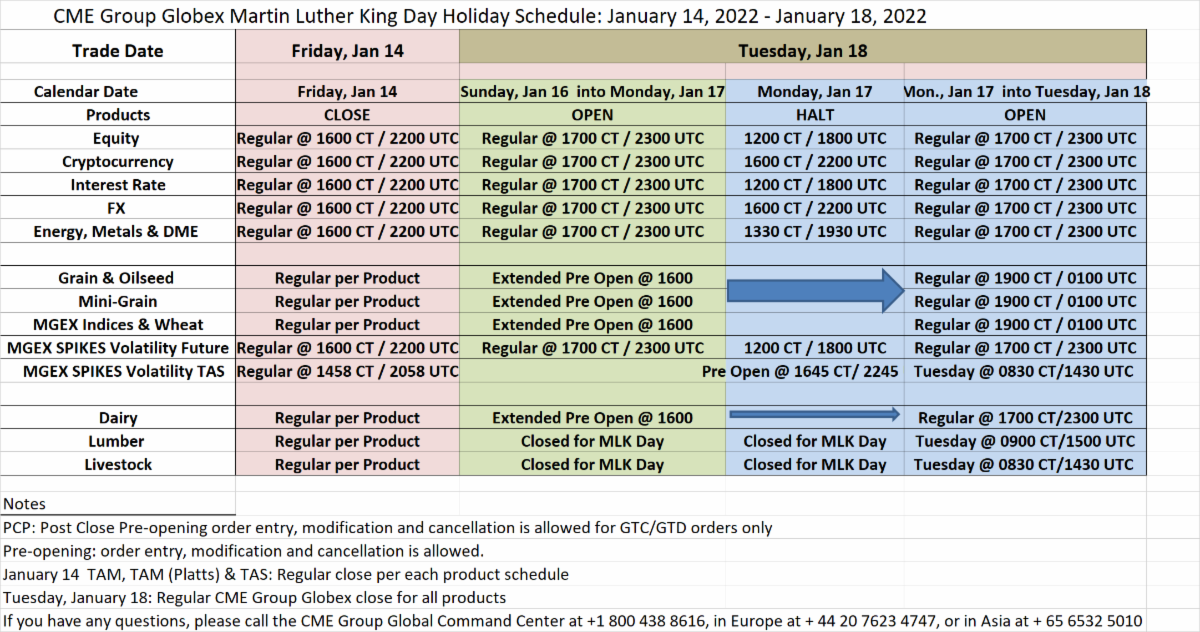
Weekly Newsletter #1082: MLK Trading Hours 2022, Day Trading Using Counter Trend or Trend Following Concepts Video and Trading Levels for the Week Ahead

Cannon Futures Weekly Newsletter Issue # 1082

Dear Traders,

Like us on FaceBook!
Get Real Time updates and market alerts on Twitter!

Trading 101: Trading Video: How I like to day-trade futures using either counter trend or trend following concepts ( or what I call simpler approach to day trading)
In This 25 Minutes Video You Will Learn The Following:
1. Possible advantages of using range bar charts over time charts for day trading
2. Trade set ups using counter trend indicators
3. Trade set ups using trend following indicators
4. The concept of price confirmation
5. Tips and insights from Ilan’s observations of different markets
6. You will be able to install the indicators/concepts mentioned and practice right away with your own demo!
494af72d 0335 4c46 82fd 70907c13c966
Good Trading

Trading Futures, Options on Futures, and retail off-exchange foreign currency transactions involves substantial risk of loss and is not suitable for all investors.  You should carefully consider whether trading is suitable for you in light of your circumstances, knowledge, and financial resources. You may lose all or more of your initial investment. Opinions, market data, and recommendations are subject to change at any time when it comes to Futures Trading.


Futures Trading Levels

01-17-2022
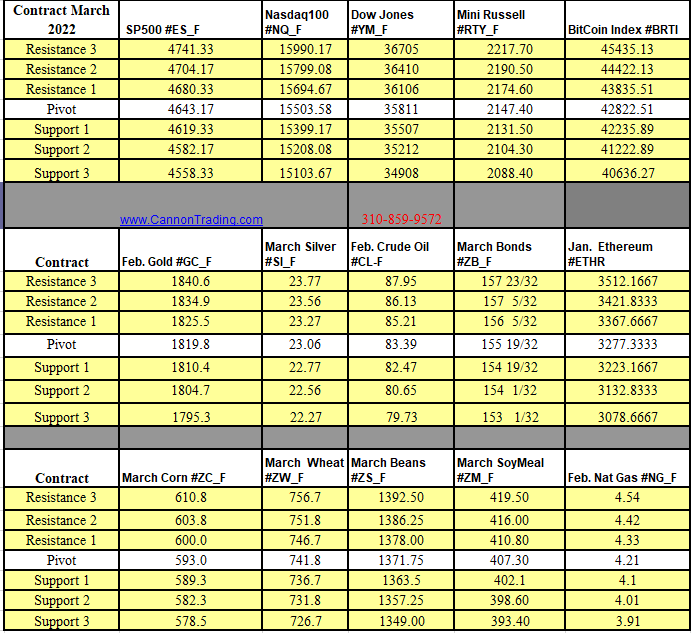
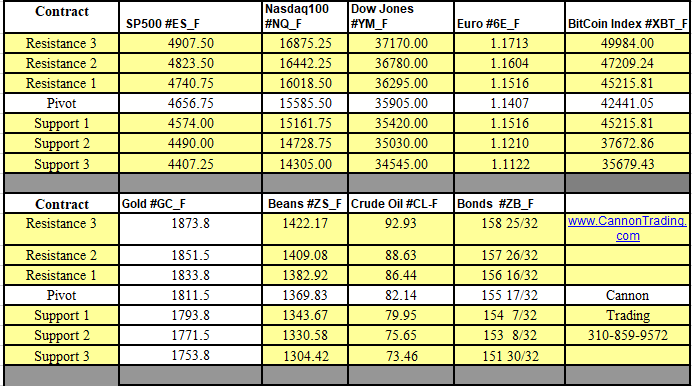
Futures Trading Support and Resistance Levels 1.17.2022


Weekly Levels

Weekly Support & Resistance Levels 1.17 - 1.21.2022

Reports, First Notice (FN), Last trading (LT) Days for the Week:

https://mrci.com

Date Reports/Expiration Notice Dates

09f9bb22 1a22 41e4 8c08 0eab33059581

This is not a solicitation of any order to buy or sell, but a current market view provided by Cannon Trading Inc. Any statement of facts herein contained are derived from sources believed to be reliable but are not guaranteed as to accuracy, nor they purport to be complete. No responsibility is assumed with respect to any such statement or with respect to any expression of opinion herein contained. Readers are urged to exercise their own judgment in tradin

Using Tick and Volume Charts for Future Day Traders 4.22.2016

Connect with Us! Use Our Futures Trading Levels and Economic Reports RSS Feed.

Like us on FacebookFollow us on TwitterView our profile on LinkedInFind us on Google+Cannon Trading Futures Trading Resistance & Support Levels and Economic ReportsFind us on Yelp

1. Market Commentary
2. Futures Support and Resistance Levels – S&P, Nasdaq, Dow Jones, Russell 2000, Dollar Index
3. Commodities Support and Resistance Levels – Gold, Euro, Crude Oil, T-Bonds
4. Commodities Support and Resistance Levels – Corn, Wheat, Beans, Silver
5. Futures Economic Reports for Friday April 22, 2016

Hello Traders,

For 2016 I would like to wish all of you discipline and patience in your trading!

Voted #1 futures trading blog!

Greetings!

Why I like to use tick and volume charts for scalping

Today I decided to touch more on an educational feature rather than provide a certain market outlook.

Many of my clients and blog readers know that when it comes to short term trading I am a fan of using volume charts, tick charts, range bar charts and Renko charts rather than the traditional time charts like the 1 minutes, 5 minutes etc.

My rule of thumb is that if you as a trader make decisions based on charts that are less than 15 minutes time frame, it may be worth your time to research, back test and do some homework as to potentially using other type of charts like volume charts , Range charts etc.

Volume charts will draw a new bar once a user defined number of contracts traded. Example mini SP 10,000 volume chart will draw a new bar once 10,000 contracts traded.

Range bar charts will draw new charts once price action has exceeded a user pre define price or ticks range. Example might be an 18 ticks range bar chart on crude oil.

Continue reading “Using Tick and Volume Charts for Future Day Traders 4.22.2016”

Look Before You Leap 3.18.2016

Connect with Us! Use Our Futures Trading Levels and Economic Reports RSS Feed.

Like us on FacebookFollow us on TwitterView our profile on LinkedInFind us on Google+Cannon Trading Futures Trading Resistance & Support Levels and Economic ReportsFind us on Yelp

1. Market Commentary
2. Futures Support and Resistance Levels – S&P, Nasdaq, Dow Jones, Russell 2000, Dollar Index
3. Commodities Support and Resistance Levels – Gold, Euro, Crude Oil, T-Bonds
4. Commodities Support and Resistance Levels – Corn, Wheat, Beans, Silver
5. Futures Economic Reports for Friday March 18, 2016

Hello Traders,

For 2016 I would like to wish all of you discipline and patience in your trading!

Greetings!

A great trading advice  by my colleague, Steven Nimerov who has over 25 years of experience starting on the floor of the CME.

“Look Before You Leap”

On the way to becoming a successful Futures trader you will incur many losses.
That I can attest to.

One way to guarantee you will never be a successful trader is by taking “out sized” losses.

There was a time, in my 40 year career, that I would get an idea, in my head, that I had to be in a market, jump in and then look at where a proper stop loss would have to be placed and panic because the loss would be too great if the stop loss was reached.
So being the rookie that I was, I would place what was known as a “money’ stop, which is one that is based on how much money I was willing to risk rather one that was based on support or resistance.

Continue reading “Look Before You Leap 3.18.2016”

Managing Your Futures Trading/Position 3.15.2016

Connect with Us! Use Our Futures Trading Levels and Economic Reports RSS Feed.

Like us on FacebookFollow us on TwitterView our profile on LinkedInFind us on Google+Cannon Trading Futures Trading Resistance & Support Levels and Economic ReportsFind us on Yelp

1. Market Commentary
2. Futures Support and Resistance Levels – S&P, Nasdaq, Dow Jones, Russell 2000, Dollar Index
3. Commodities Support and Resistance Levels – Gold, Euro, Crude Oil, T-Bonds
4. Commodities Support and Resistance Levels – Corn, Wheat, Beans, Silver
5. Futures Economic Reports for Tuesday March 15, 2016

Hello Traders,

For 2016 I would like to wish all of you discipline and patience in your trading!

Greetings! 

FRONT MONTH for STOCK INDEX is JUNE!!

A note on managing trade size by my colleague, John Thorpe who has over 25 years of experience starting on the floor of the CBOT.

Managing your trading/position size is crucial to long term success regardless of style.

Daytrading, Swing or long term position trading.

In order to select the size you will employ make a mental note of three things before you trade.  The Foundation of Trading your plan is first determining the size you will be employing, the number of contracts.

We must assume your risk capital is fixed.

1)  How liquid is the contract I will be trading?

Are there frequent price gaps, lack of continuity with bid/ask spreads.

What is the Open Interest and Volume relative to other contracts in the same industry, index , futures contract type.

Continue reading “Managing Your Futures Trading/Position 3.15.2016”

Trade Management is more important than Market Analysis….

Connect with Us! Use Our Futures Trading Levels and Economic Reports RSS Feed.

Like us on FacebookFollow us on TwitterView our profile on LinkedInFind us on Google+Cannon Trading Futures Trading Resistance & Support Levels and Economic ReportsFind us on Yelp

1. Market Commentary
2. Futures Support and Resistance Levels – S&P, Nasdaq, Dow Jones, Russell 2000, Dollar Index
3. Commodities Support and Resistance Levels – Gold, Euro, Crude Oil, T-Bonds
4. Commodities Support and Resistance Levels – Corn, Wheat, Beans, Silver
5. Futures Economic Reports for Thursday February 25, 2016

Hello Traders,

For 2016 I would like to wish all of you discipline and patience in your trading!

Greetings!

Trade management is more important than Market Analysis….

I have done this so many times before, my colleagues tell me when it happens to them as well as some of my clients….You have the perfect read on the market. The market actually ends up doing what you thought it would and in a BIG way…yet somehow you manage to LOSE money despite your perfect analysis. To me this is sometimes more frustrating than having a bad losing day.

What happened?

Poor trade management, that’s what happened.

Yes, reading the market well is a much needed quality if you plan on making money rather than contributing donations to the market but more important is how you manage the trade / position once you read the market. Much easier said than done, especially after the fact but here are some tips that I am hoping will assist you in the next time you have a good market read.

Continue reading “Trade Management is more important than Market Analysis….”

Breakout Trading, Mean Reversion & Levels for Friday 2.19.2016

Connect with Us! Use Our Futures Trading Levels and Economic Reports RSS Feed.

Like us on FacebookFollow us on TwitterView our profile on LinkedInFind us on Google+Cannon Trading Futures Trading Resistance & Support Levels and Economic ReportsFind us on Yelp

1. Market Commentary
2. Futures Support and Resistance Levels – S&P, Nasdaq, Dow Jones, Russell 2000, Dollar Index
3. Commodities Support and Resistance Levels – Gold, Euro, Crude Oil, T-Bonds
4. Commodities Support and Resistance Levels – Corn, Wheat, Beans, Silver
5. Futures Economic Reports for Wednesday February 17, 2016

Hello Traders,

For 2016 I would like to wish all of you discipline and patience in your trading!

Greetings!

Many different ways to make and lose money trading futures, even more so when day trading.

Today’s action in gold futures ( break out) led me to write about:

Three main approaches for trading, in my opinion.

The first is what I call the “trend is your friend”. A trader looks at few different time frames, looking to see if there is an established trend on longer time frame ( example 60 minutes chart) and then trying to look for pull back on lower time frames and “join the trend”. Only works for certain markets and only works few times of the month as most days markets do not have an intraday trend.

Second method is what we call break out. Traders will look for markets that have been in a lower volatility situation using indicators such as ADX for example. Then they will look at the chart to find what they feel are levels that if broken can fuel a stronger move in the same direction. These levels can be extracted visually looking at the chart or using highs/ lows of X periods. This method works better on some markets than others. I noticed that crude oil and gold futures tend to have better chances of a continued breakout move than the mini SP 500 for example.

The third one many traders use and believe in is “mean aversion”. Stock index futures in my opinion will fall into this category many trading days and today’s session ( July 24th 2014) was a good example. Market tested yesterday’s highs, then tested lows and traded in between. Traders will sometimes use RSI or Williams %R to get a feel for when the market gets away from the mean and will use counter trend methods in this case. Use of stops, when counter trend trading is even more important as you do NOT want to get caught on the few days a month when these markets do incur a break out situation…..

Obviously, all methods have good days, bad days and I guarantee you, none of these methods work all the time on all markets. Knowing the above and trying to understand what method should be the primary method for the market YOU trade and which can be used as secondary can help you while trading.

TRADE SMART / TRADE SYSTEMS — for the current rankings as well as actual performance of trading systems traded at Striker, click here.

Continue reading “Breakout Trading, Mean Reversion & Levels for Friday 2.19.2016”

Different Type of Trading Days–Levels for 2.18.2016

Connect with Us! Use Our Futures Trading Levels and Economic Reports RSS Feed.

Like us on FacebookFollow us on TwitterView our profile on LinkedInFind us on Google+Cannon Trading Futures Trading Resistance & Support Levels and Economic ReportsFind us on Yelp

1. Market Commentary
2. Futures Support and Resistance Levels – S&P, Nasdaq, Dow Jones, Russell 2000, Dollar Index
3. Commodities Support and Resistance Levels – Gold, Euro, Crude Oil, T-Bonds
4. Commodities Support and Resistance Levels – Corn, Wheat, Beans, Silver
5. Futures Economic Reports for Wednesday February 17, 2016

Hello Traders,

For 2016 I would like to wish all of you discipline and patience in your trading!

Greetings!

In the last few weeks we witnessed “volatile trading” with high volume and some wild swings. Much different than the quiet days we had about a year ago…. which encouraged me to share the following with you on the different types of trading days:

  • In my opinion there are 3 main types of trading days.

1. The most common day are two sided trading action with swings up and down – this type of trading day is most suitable for using support and resistance levels along with overbought/oversold indicators.

2. Strong trending days, mostly one directional – this type of trading day is the least common, many times will happen on Mondays and maybe 3-5 times a month at most – this type of trading day is most suitable for using ADX, MACD crossovers and pretty much looking for pullbacks to jump on the trend.

3. Slow and/or choppy trading days – this type of trading day is best suited for taking small profits from the market by looking at volume spikes, using stochastics as possible entry signals and usually wait for a pullback before jumping in.

Continue reading “Different Type of Trading Days–Levels for 2.18.2016”

Free Futures Educational Reads 2.10.2016

Connect with Us! Use Our Futures Trading Levels and Economic Reports RSS Feed.

Like us on FacebookFollow us on TwitterView our profile on LinkedInFind us on Google+Cannon Trading Futures Trading Resistance & Support Levels and Economic ReportsFind us on Yelp

1. Market Commentary
2. Futures Support and Resistance Levels – S&P, Nasdaq, Dow Jones, Russell 2000, Dollar Index
3. Commodities Support and Resistance Levels – Gold, Euro, Crude Oil, T-Bonds
4. Commodities Support and Resistance Levels – Corn, Wheat, Beans, Silver
5. Futures Economic Reports for Wednesday February 10, 2016

Hello Traders,

For 2016 I would like to wish all of you discipline and patience in your trading!

Spotting Clues Day Trading Futures 2.02.2016

Connect with Us! Use Our Futures Trading Levels and Economic Reports RSS Feed.

Like us on FacebookFollow us on TwitterView our profile on LinkedInFind us on Google+Cannon Trading Futures Trading Resistance & Support Levels and Economic ReportsFind us on Yelp

1. Market Commentary
2. Futures Support and Resistance Levels – S&P, Nasdaq, Dow Jones, Russell 2000, Dollar Index
3. Commodities Support and Resistance Levels – Gold, Euro, Crude Oil, T-Bonds
4. Commodities Support and Resistance Levels – Corn, Wheat, Beans, Silver
5. Futures Economic Reports for Tuesday February 2, 2016

Hello Traders,

For 2015 I would like to wish all of you discipline and patience in your trading!

Getting Clues from other markets?

When day-trading a specific market do you only look at the chart for that specific market? maybe you took it a step further and you are viewing multiple time frame charts for the same market which is a good step in my eyes.

Now lets take this even one step further by observing what markets have correlation, direct or inverse to the market you are trading, perhaps this can help you make decisions when trading.

I will give a few examples from my experience:
When I am in a position in the mini SP 500, I will often observe what the bonds are doing ( many times inverse correlation), I will take notice of what the Dow, Russell and NASDAQ are doing as well ( direct correlation)

If I am trading crude oil, I will many times pay attention to what unleaded gas and heating oil are doing (very close, although not direct correlation) as well as what WTI crude is doing.

Continue reading “Spotting Clues Day Trading Futures 2.02.2016”